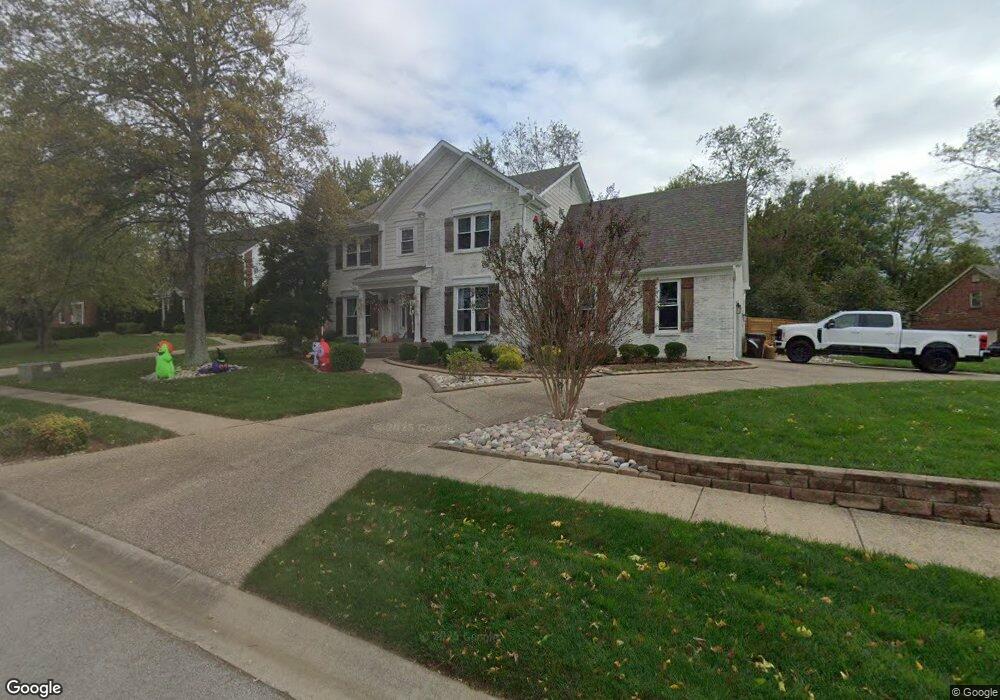
11100 Foxbrook Ct Louisville, KY 40223
Estimated Value: $489,592 - $538,000
2
Beds
3
Baths
2,638
Sq Ft
$197/Sq Ft
Est. Value
About This Home
This home is located at 11100 Foxbrook Ct, Louisville, KY 40223 and is currently estimated at $520,648, approximately $197 per square foot. 11100 Foxbrook Ct is a home located in Jefferson County with nearby schools including Middletown Elementary School, Hite Elementary School, and Bowen Elementary School.
Ownership History
Date
Name
Owned For
Owner Type
Purchase Details
Closed on
Nov 11, 2022
Sold by
Lacey Clifford A and Lacey Stephen
Bought by
J Bauer Properties Llc
Current Estimated Value
Purchase Details
Closed on
Apr 27, 2018
Sold by
Just In Home Mart Llc
Bought by
Bauer Justin and Bauer Jenna
Home Financials for this Owner
Home Financials are based on the most recent Mortgage that was taken out on this home.
Original Mortgage
$333,000
Interest Rate
4.45%
Mortgage Type
New Conventional
Purchase Details
Closed on
Oct 31, 2017
Sold by
Knoopf Development Llc
Bought by
Just In Home Mart Llc
Purchase Details
Closed on
Oct 25, 2017
Sold by
Hall Barrett George N and Hall Barrett Stephanie
Bought by
Knopf Development Llc
Purchase Details
Closed on
Oct 16, 2017
Sold by
Morris Brittany
Bought by
Barrett George
Create a Home Valuation Report for This Property
The Home Valuation Report is an in-depth analysis detailing your home's value as well as a comparison with similar homes in the area
Home Values in the Area
Average Home Value in this Area
Purchase History
| Date | Buyer | Sale Price | Title Company |
|---|---|---|---|
| J Bauer Properties Llc | $140,000 | Limestone Title & Escrow | |
| J Bauer Properties Llc | $140,000 | Limestone Title & Escrow | |
| Bauer Justin | $370,000 | Limestone Title & Escrow Llc | |
| Just In Home Mart Llc | $235,000 | Limestone Title & Escrow Llc | |
| Knopf Development Llc | $215,000 | Limestone Title & Escrow Llc | |
| Barrett George | $175,000 | Limestone Title & Escrow Llc |
Source: Public Records
Mortgage History
| Date | Status | Borrower | Loan Amount |
|---|---|---|---|
| Previous Owner | Bauer Justin | $333,000 |
Source: Public Records
Tax History Compared to Growth
Tax History
| Year | Tax Paid | Tax Assessment Tax Assessment Total Assessment is a certain percentage of the fair market value that is determined by local assessors to be the total taxable value of land and additions on the property. | Land | Improvement |
|---|---|---|---|---|
| 2024 | $4,307 | $378,440 | $80,000 | $298,440 |
| 2023 | $4,382 | $378,440 | $80,000 | $298,440 |
| 2022 | $4,397 | $370,000 | $50,000 | $320,000 |
| 2021 | $4,643 | $370,000 | $50,000 | $320,000 |
| 2020 | $4,262 | $370,000 | $50,000 | $320,000 |
| 2019 | $4,177 | $370,000 | $50,000 | $320,000 |
| 2018 | $3,135 | $281,040 | $50,000 | $231,040 |
| 2017 | $2,950 | $281,040 | $50,000 | $231,040 |
| 2013 | $2,656 | $265,640 | $40,000 | $225,640 |
Source: Public Records
Map
Nearby Homes
- 502 Willow Stone Way
- 421 Creason Ct Unit 207
- 319 Old Harrods Creek Rd
- 410 Ethridge Ave Unit 207
- 10745 Colonial Woods Ct
- 10611 Riva Rd
- 1102 La Fontenay Ct
- 1119 La Fontenay Ct Unit 1119
- 1116 La Fontenay Ct Unit 1116
- 201 Lanark Place
- 207 N Madison Ave
- 10622 Riva Rd Unit 10622
- 1002 La Fontenay Ct Unit 1102
- 404 La Fontenay Ct Unit 404
- 812 La Fontenay Ct Unit 812
- 806 La Fontenay Ct
- 207 La Fontenay Ct Unit 207
- 211 La Fontenay Ct Unit 211
- 706 La Fontenay Ct Unit 706
- 212 La Fontenay Ct Unit 212
- 11102 Foxbrook Ct
- 11203 Brookstone Place
- 601 Brookstone Way
- 604 Brookstone Way
- 11104 Foxbrook Ct
- 605 Brookstone Way
- 602 Brookstone Way
- 11205 Brookstone Place
- 11106 Foxbrook Ct
- 606 Brookstone Way
- 600 Brookstone Way
- 703 Foxgate Rd
- 711 Foxgate Rd
- 515 Brookstone Way
- 11103 Foxbrook Ct
- 11103 Foxgate Place
- 520 Malcolm Ave
- 11204 Brookstone Place
- 11105 Foxbrook Ct
- 514 Malcolm Ave