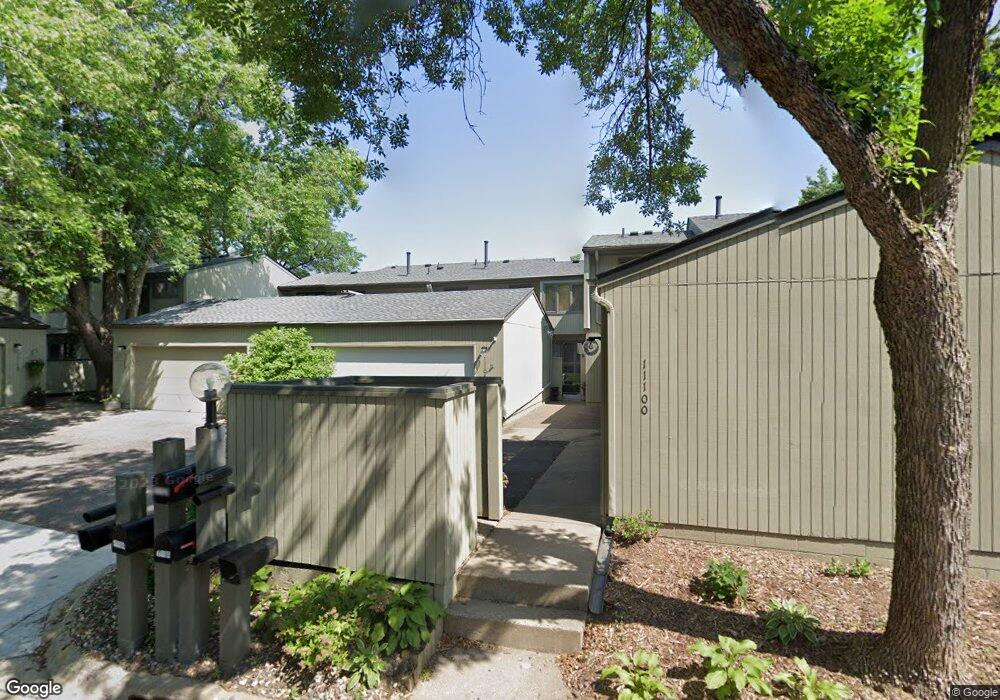
11104 Abbott Ln Hopkins, MN 55343
Estimated Value: $343,000 - $374,175
3
Beds
4
Baths
1,784
Sq Ft
$202/Sq Ft
Est. Value
About This Home
This home is located at 11104 Abbott Ln, Hopkins, MN 55343 and is currently estimated at $360,044, approximately $201 per square foot. 11104 Abbott Ln is a home located in Hennepin County with nearby schools including Gatewood Elementary School, Hopkins West Junior High School, and Hopkins Senior High School.
Ownership History
Date
Name
Owned For
Owner Type
Purchase Details
Closed on
Sep 14, 2016
Sold by
Moore Reuben Julius Lemuel
Bought by
Rondeau Debra
Current Estimated Value
Home Financials for this Owner
Home Financials are based on the most recent Mortgage that was taken out on this home.
Original Mortgage
$206,097
Outstanding Balance
$164,622
Interest Rate
3.43%
Mortgage Type
FHA
Estimated Equity
$195,422
Purchase Details
Closed on
Apr 14, 2014
Sold by
Tcf National Bank
Bought by
Moore Reuben Julius Lemuel
Purchase Details
Closed on
Mar 15, 2011
Sold by
Tcf National Bank
Bought by
Moore Reuben Julius Lemuel
Purchase Details
Closed on
Dec 5, 1997
Sold by
Speed John A and Speed Carolyn E
Bought by
Billey Maxine
Create a Home Valuation Report for This Property
The Home Valuation Report is an in-depth analysis detailing your home's value as well as a comparison with similar homes in the area
Home Values in the Area
Average Home Value in this Area
Purchase History
| Date | Buyer | Sale Price | Title Company |
|---|---|---|---|
| Rondeau Debra | $209,900 | Liberty Title Inc | |
| Moore Reuben Julius Lemuel | $125,000 | None Available | |
| Moore Reuben Julius Lemuel | $125,000 | -- | |
| Billey Maxine | $130,000 | -- |
Source: Public Records
Mortgage History
| Date | Status | Borrower | Loan Amount |
|---|---|---|---|
| Open | Rondeau Debra | $206,097 | |
| Closed | Moore Reuben Julius Lemuel | -- |
Source: Public Records
Tax History Compared to Growth
Tax History
| Year | Tax Paid | Tax Assessment Tax Assessment Total Assessment is a certain percentage of the fair market value that is determined by local assessors to be the total taxable value of land and additions on the property. | Land | Improvement |
|---|---|---|---|---|
| 2024 | $4,109 | $348,600 | $54,000 | $294,600 |
| 2023 | $4,172 | $357,700 | $54,000 | $303,700 |
| 2022 | $3,801 | $352,500 | $54,000 | $298,500 |
| 2021 | $3,631 | $311,100 | $50,000 | $261,100 |
| 2020 | $3,228 | $301,800 | $50,000 | $251,800 |
| 2019 | $3,100 | $258,900 | $50,000 | $208,900 |
| 2018 | $2,681 | $251,800 | $50,000 | $201,800 |
| 2017 | $2,768 | $218,000 | $50,000 | $168,000 |
| 2016 | $2,641 | $204,200 | $50,000 | $154,200 |
| 2015 | $2,725 | $205,600 | $40,000 | $165,600 |
| 2014 | -- | $205,600 | $40,000 | $165,600 |
Source: Public Records
Map
Nearby Homes
- 11409 Bren Rd
- 11413 Bren Rd
- 5754 Shady Oak Rd S Unit 1
- 5742 Shady Oak Rd S Unit 7
- 5601 Bimini Dr
- 5998 Chasewood Pkwy Unit 1
- 5524 Bimini Dr
- 6048 Chasewood Pkwy Unit 204
- 6020 Chasewood Pkwy Unit 203
- 5697 Green Circle Dr Unit 219
- 1252 Trailwood S
- 5607 Green Circle Dr Unit 209
- 5607 Green Circle Dr Unit 210
- 1124 Trailwood S
- 801 Smetana Rd Unit 7
- 806 Old Settlers Trail Unit 8
- 1228 Wagon Wheel Rd
- 5470 Rowland Rd
- 702 Old Settlers Trail Unit 3
- 920 9th Ave S Unit 5
- 11108 Abbott Ln
- 11100 Abbott Ln
- 11112 Abbott Ln
- 11020 Abbott Ln
- 11016 Abbott Ln
- 11012 Abbott Ln
- 11116 Abbott Ln
- 11116 Abbott Ln
- 11008 Abbott Ln
- 11120 Abbott Ln
- 11017 Abbott Ln
- 11004 Abbott Ln
- 11013 Abbott Ln
- 11124 Abbott Ln
- 11000 Abbott Ln
- 11009 Abbott Ln
- 11128 Abbott Ln
- 11005 Abbott Ln
- 11132 Abbott Ln
- 11001 Abbott Ln