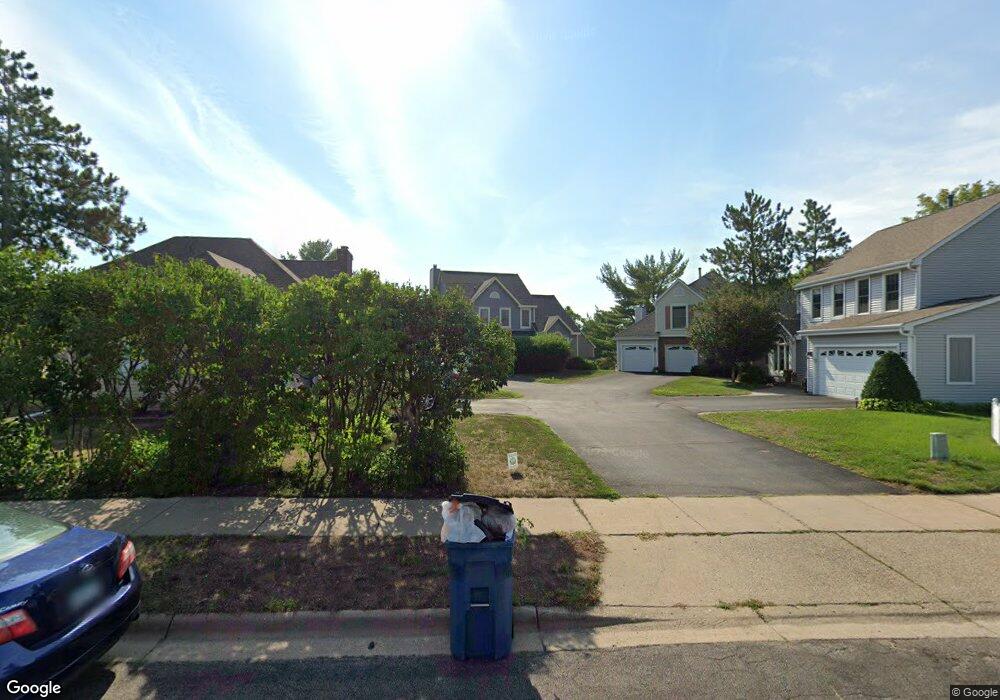
11105 Sumter Ave S Bloomington, MN 55438
West Bloomington NeighborhoodEstimated Value: $390,000 - $474,000
3
Beds
3
Baths
907
Sq Ft
$462/Sq Ft
Est. Value
About This Home
This home is located at 11105 Sumter Ave S, Bloomington, MN 55438 and is currently estimated at $419,294, approximately $462 per square foot. 11105 Sumter Ave S is a home located in Hennepin County with nearby schools including Olson Elementary School, Olson Middle School, and Jefferson Senior High School.
Ownership History
Date
Name
Owned For
Owner Type
Purchase Details
Closed on
Mar 27, 2019
Sold by
Karow Laura J
Bought by
Sanford Evan M
Current Estimated Value
Home Financials for this Owner
Home Financials are based on the most recent Mortgage that was taken out on this home.
Original Mortgage
$279,000
Outstanding Balance
$245,291
Interest Rate
4.3%
Mortgage Type
New Conventional
Estimated Equity
$174,003
Purchase Details
Closed on
Oct 28, 2015
Sold by
Mcknight Catherine C
Bought by
Karow Laura J
Home Financials for this Owner
Home Financials are based on the most recent Mortgage that was taken out on this home.
Original Mortgage
$237,500
Interest Rate
3.78%
Mortgage Type
New Conventional
Purchase Details
Closed on
Feb 7, 2007
Sold by
Not Provided and Yue Jin Ming
Bought by
Mcknight Catherine C
Purchase Details
Closed on
Jul 25, 2002
Sold by
Monson A Herbert and Monson Betty L
Bought by
Wang Mei and Yue Jinming
Create a Home Valuation Report for This Property
The Home Valuation Report is an in-depth analysis detailing your home's value as well as a comparison with similar homes in the area
Home Values in the Area
Average Home Value in this Area
Purchase History
| Date | Buyer | Sale Price | Title Company |
|---|---|---|---|
| Sanford Evan M | $310,000 | Edina Realty Title Inc | |
| Karow Laura J | $250,000 | Burnet Title | |
| Mcknight Catherine C | $256,500 | -- | |
| Wang Mei | $223,000 | -- |
Source: Public Records
Mortgage History
| Date | Status | Borrower | Loan Amount |
|---|---|---|---|
| Open | Sanford Evan M | $279,000 | |
| Previous Owner | Karow Laura J | $237,500 |
Source: Public Records
Tax History Compared to Growth
Tax History
| Year | Tax Paid | Tax Assessment Tax Assessment Total Assessment is a certain percentage of the fair market value that is determined by local assessors to be the total taxable value of land and additions on the property. | Land | Improvement |
|---|---|---|---|---|
| 2024 | $4,592 | $366,000 | $116,500 | $249,500 |
| 2023 | $4,276 | $359,600 | $116,500 | $243,100 |
| 2022 | $3,661 | $335,700 | $102,200 | $233,500 |
| 2021 | $3,542 | $295,100 | $97,300 | $197,800 |
| 2020 | $3,240 | $288,900 | $75,600 | $213,300 |
| 2019 | $3,352 | $260,100 | $75,600 | $184,500 |
| 2018 | $3,535 | $263,600 | $76,200 | $187,400 |
| 2017 | $2,806 | $221,500 | $66,000 | $155,500 |
| 2016 | $3,058 | $227,800 | $59,500 | $168,300 |
| 2015 | $3,253 | $232,100 | $57,800 | $174,300 |
| 2014 | -- | $204,100 | $56,000 | $148,100 |
Source: Public Records
Map
Nearby Homes
- 7471 W 110th St
- 7525 W 110th St Unit 7
- 11036 Quebec Cir
- 11048 Quebec Cir
- 7518 W 110th St
- 11159 Sumter Ave S
- 11058 Oregon Curve
- 10907 Rhode Island Ave S
- 11015 Oregon Curve
- 11275 Oregon Cir
- 10935 Oregon Ave S
- 11073 Oregon Cir Unit 69
- 11200 Wyoming Rd S
- 8022 W 111th St Unit 8022
- 7321 Woodstock Curve
- 7019 W 110th Street Cir Unit 15
- 7106 W 113th St
- 7062 W 113th St Unit 1
- 7500 Landau Dr
- 7256 Woodstock Dr
- 7539 W 111th St
- 11136 Rhode Island Ave S
- 11101 Sumter Ave S
- 11113 Sumter Ave S
- 11140 Rhode Island Ave S
- 7535 W 111th St
- 7531 W 111th St
- 11132 Rhode Island Ave S
- 11144 Rhode Island Ave S
- 7527 W 111th St
- 7532 W 111th St
- 7523 W 111th St
- 7542 W 111th St
- 11128 Rhode Island Ave S
- 7601 W 111th St
- 11112 Sumter Ave S
- 11148 Rhode Island Ave S
- 11112 Rhode Island Ave S
- 11120 Rhode Island Ave S
- 7600 W 111th St