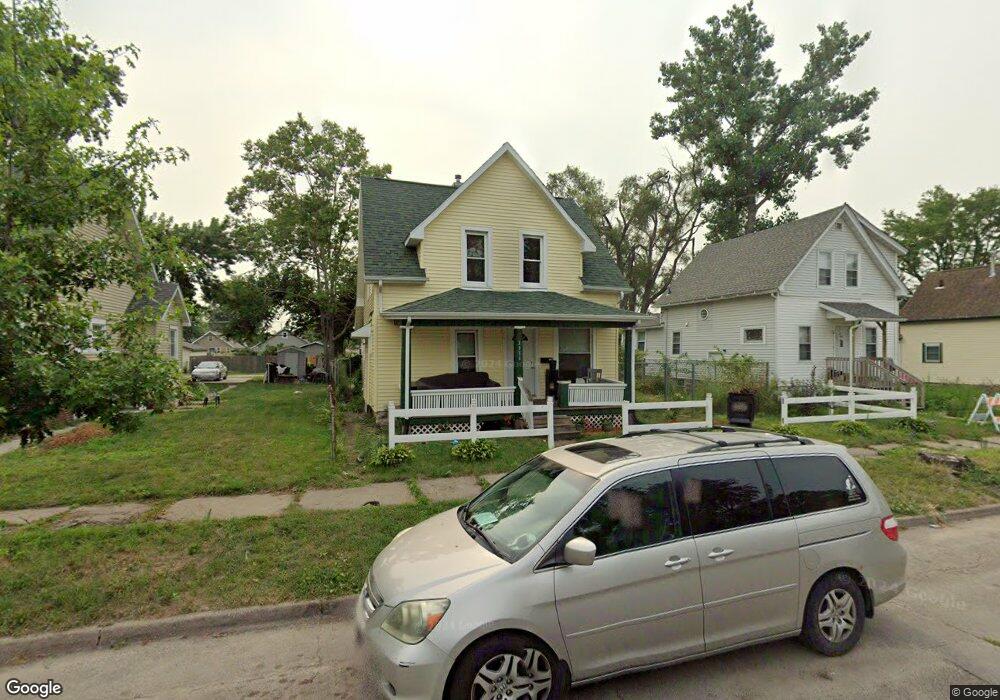
1111 10th St NW Cedar Rapids, IA 52405
Northwest Area NeighborhoodEstimated Value: $131,000 - $141,000
4
Beds
2
Baths
1,219
Sq Ft
$112/Sq Ft
Est. Value
About This Home
This home is located at 1111 10th St NW, Cedar Rapids, IA 52405 and is currently estimated at $136,720, approximately $112 per square foot. 1111 10th St NW is a home located in Linn County with nearby schools including Harrison Elementary School, Roosevelt Creative Corridor Business Academy, and Thomas Jefferson High School.
Ownership History
Date
Name
Owned For
Owner Type
Purchase Details
Closed on
Apr 20, 2009
Sold by
Smith Danielle
Bought by
Vandeusen Larry E and Vandeusen Van Deusen
Current Estimated Value
Home Financials for this Owner
Home Financials are based on the most recent Mortgage that was taken out on this home.
Original Mortgage
$85,000
Outstanding Balance
$53,416
Interest Rate
4.83%
Mortgage Type
Credit Line Revolving
Estimated Equity
$83,305
Purchase Details
Closed on
Jun 28, 2001
Sold by
Obrien Jason C
Bought by
Smith Lawrence D and Ogeary Smith Nancy
Home Financials for this Owner
Home Financials are based on the most recent Mortgage that was taken out on this home.
Original Mortgage
$51,000
Interest Rate
7.5%
Purchase Details
Closed on
Aug 28, 1999
Sold by
Martin Herbert V and Martin Vicki Sue
Bought by
Obrien Jason C
Home Financials for this Owner
Home Financials are based on the most recent Mortgage that was taken out on this home.
Original Mortgage
$53,955
Interest Rate
7.59%
Create a Home Valuation Report for This Property
The Home Valuation Report is an in-depth analysis detailing your home's value as well as a comparison with similar homes in the area
Home Values in the Area
Average Home Value in this Area
Purchase History
| Date | Buyer | Sale Price | Title Company |
|---|---|---|---|
| Vandeusen Larry E | $14,500 | None Available | |
| Smith Lawrence D | $59,500 | -- | |
| Obrien Jason C | $59,500 | -- |
Source: Public Records
Mortgage History
| Date | Status | Borrower | Loan Amount |
|---|---|---|---|
| Open | Vandeusen Larry E | $85,000 | |
| Previous Owner | Smith Lawrence D | $51,000 | |
| Previous Owner | Obrien Jason C | $53,955 |
Source: Public Records
Tax History
| Year | Tax Paid | Tax Assessment Tax Assessment Total Assessment is a certain percentage of the fair market value that is determined by local assessors to be the total taxable value of land and additions on the property. | Land | Improvement |
|---|---|---|---|---|
| 2025 | $2,066 | $111,300 | $29,700 | $81,600 |
| 2024 | $2,026 | $116,800 | $24,800 | $92,000 |
| 2023 | $2,026 | $116,800 | $24,800 | $92,000 |
| 2022 | $1,940 | $96,100 | $24,800 | $71,300 |
| 2021 | $1,882 | $93,600 | $22,300 | $71,300 |
| 2020 | $1,882 | $85,300 | $22,300 | $63,000 |
| 2019 | $1,698 | $78,800 | $19,800 | $59,000 |
Source: Public Records
Map
Nearby Homes
- 1121 11th St NW
- 1009 10th St NW
- 1114 11th St NW
- 816 10th St NW
- 819 G Ave NW
- 1058 G Ave NW
- 514 9th St NW
- 718 4th St NW
- 1620 9th St NW
- 1625 11th St NW
- 1621 13th St NW
- 1525 N Ave NW
- 1024 Cheyenne Rd NW
- 1119 18th St NW
- 1218 B Ave NW
- 409 A Ave NW
- 911 A Ave NW
- 1020 A Ave NW
- 1338 Hinkley Ave NW
- 1860 E Ave NW
- 1117 10th St NW
- 1101 10th St NW
- 1123 10th St NW
- 910 J Ave NW
- 1110 9th St NW
- 1106 9th St NW
- 1116 9th St NW
- 1125 10th St NW
- 1116 10th St NW
- 1124 9th St NW
- 1112 10th St NW
- 1100 9th St NW
- 1116 10th St NW
- 1127 10th St NW
- 1126 9th St NW
- 1100 10th St NW
- 1033 10th St NW
- 1120 10th St NW
- 1130 10th St NW
- 1130 9th St NW
Your Personal Tour Guide
Ask me questions while you tour the home.