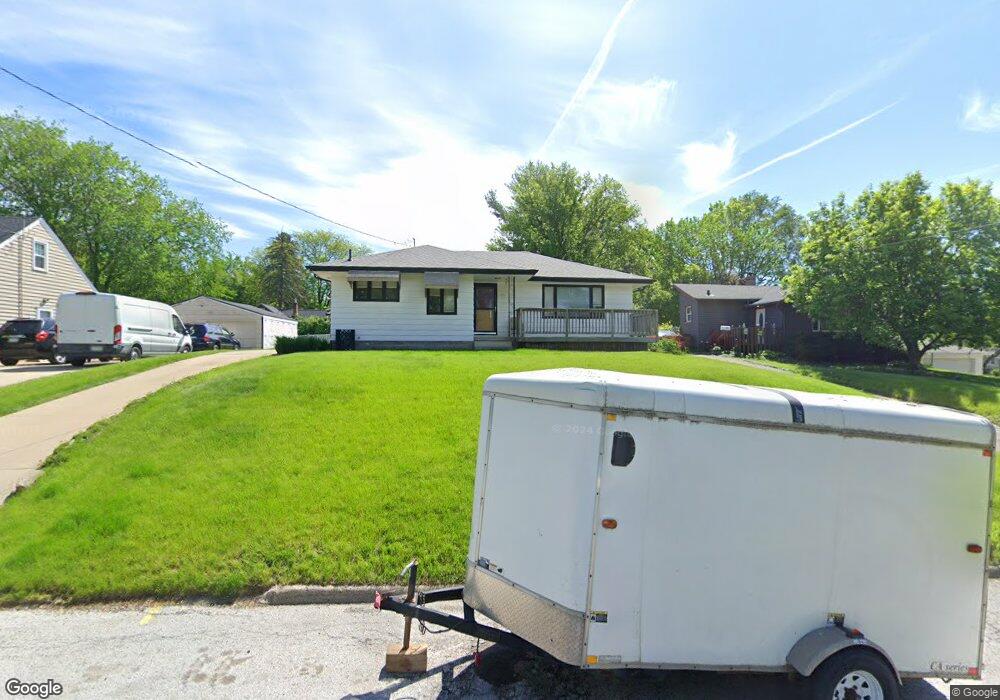
1111 68th St Windsor Heights, IA 50324
Estimated Value: $239,000 - $248,000
3
Beds
1
Bath
1,102
Sq Ft
$220/Sq Ft
Est. Value
About This Home
This home is located at 1111 68th St, Windsor Heights, IA 50324 and is currently estimated at $242,169, approximately $219 per square foot. 1111 68th St is a home located in Polk County with nearby schools including Windsor Elementary School, Merrill Middle School, and Roosevelt High School.
Ownership History
Date
Name
Owned For
Owner Type
Purchase Details
Closed on
Oct 8, 2020
Sold by
Ekis Andre
Bought by
Andre Ekis Family Trust
Current Estimated Value
Purchase Details
Closed on
Nov 18, 2005
Sold by
Ekis Andrea Lynn
Bought by
Ekis Andre
Purchase Details
Closed on
Nov 4, 2004
Sold by
Ekis Andre
Bought by
Ekis Andre and Ekis Andrea Lynn
Purchase Details
Closed on
Jan 22, 2004
Sold by
Ekis Joann
Bought by
Ekis Andre
Create a Home Valuation Report for This Property
The Home Valuation Report is an in-depth analysis detailing your home's value as well as a comparison with similar homes in the area
Home Values in the Area
Average Home Value in this Area
Purchase History
| Date | Buyer | Sale Price | Title Company |
|---|---|---|---|
| Andre Ekis Family Trust | -- | None Available | |
| Andre Ekis Family Trust | -- | None Listed On Document | |
| Ekis Andre | -- | -- | |
| Ekis Andre | -- | -- | |
| Ekis Andre | -- | -- |
Source: Public Records
Tax History
| Year | Tax Paid | Tax Assessment Tax Assessment Total Assessment is a certain percentage of the fair market value that is determined by local assessors to be the total taxable value of land and additions on the property. | Land | Improvement |
|---|---|---|---|---|
| 2025 | $3,894 | $231,600 | $56,900 | $174,700 |
| 2024 | $3,894 | $207,600 | $50,300 | $157,300 |
| 2023 | $3,724 | $207,600 | $50,300 | $157,300 |
| 2022 | $3,694 | $167,600 | $42,000 | $125,600 |
| 2021 | $3,616 | $167,600 | $42,000 | $125,600 |
| 2020 | $3,768 | $150,900 | $37,800 | $113,100 |
| 2019 | $3,828 | $150,900 | $37,800 | $113,100 |
| 2018 | $3,746 | $141,500 | $34,700 | $106,800 |
| 2017 | $3,552 | $141,500 | $34,700 | $106,800 |
| 2016 | $3,368 | $130,100 | $31,600 | $98,500 |
| 2015 | $3,368 | $130,100 | $31,600 | $98,500 |
| 2014 | $3,334 | $129,300 | $30,700 | $98,600 |
Source: Public Records
Map
Nearby Homes
- 1108 67th St
- 1102 67th St
- 1131 69th St
- 1206 68th St
- 1008 67th St
- 1007 69th St
- 1303 68th St
- 6750 School St Unit 206
- 6750 School St Unit 205
- 6423 Carpenter Ave
- 6428 Elmcrest Dr
- 1233 72nd St
- 6826 Colby Ave
- 6564 Colby Ave
- 1407 64th St
- 6513 Center St
- 3927 Westgate Pkwy
- 4052 NW 175th St
- 3945 Westgate Pkwy
- 3963 Westgate Pkwy
Your Personal Tour Guide
Ask me questions while you tour the home.