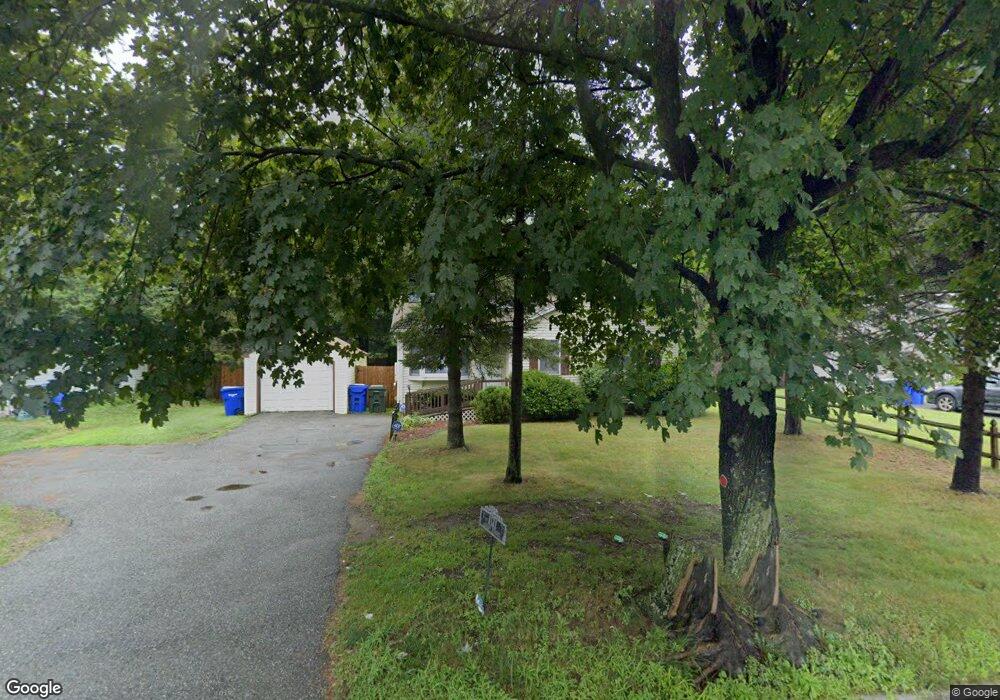
1111 Allen St Springfield, MA 01118
East Forest Park NeighborhoodEstimated Value: $260,000 - $299,000
3
Beds
1
Bath
972
Sq Ft
$295/Sq Ft
Est. Value
About This Home
This home is located at 1111 Allen St, Springfield, MA 01118 and is currently estimated at $286,835, approximately $295 per square foot. 1111 Allen St is a home located in Hampden County with nearby schools including Frederick Harris Elementary School, M Marcus Kiley Middle, and Springfield High School of Science and Technology.
Ownership History
Date
Name
Owned For
Owner Type
Purchase Details
Closed on
Feb 22, 2022
Sold by
Richardson Linda M
Bought by
Lapointe Wayne R
Current Estimated Value
Purchase Details
Closed on
Jan 31, 2000
Sold by
Superman David J
Bought by
Richardson Linda M
Home Financials for this Owner
Home Financials are based on the most recent Mortgage that was taken out on this home.
Original Mortgage
$25,000
Interest Rate
7.83%
Mortgage Type
Purchase Money Mortgage
Create a Home Valuation Report for This Property
The Home Valuation Report is an in-depth analysis detailing your home's value as well as a comparison with similar homes in the area
Home Values in the Area
Average Home Value in this Area
Purchase History
| Date | Buyer | Sale Price | Title Company |
|---|---|---|---|
| Lapointe Wayne R | -- | None Available | |
| Lapointe Wayne R | -- | None Available | |
| Richardson Linda M | $86,000 | -- |
Source: Public Records
Mortgage History
| Date | Status | Borrower | Loan Amount |
|---|---|---|---|
| Previous Owner | Richardson Linda M | $25,000 |
Source: Public Records
Tax History
| Year | Tax Paid | Tax Assessment Tax Assessment Total Assessment is a certain percentage of the fair market value that is determined by local assessors to be the total taxable value of land and additions on the property. | Land | Improvement |
|---|---|---|---|---|
| 2025 | $3,630 | $231,500 | $53,300 | $178,200 |
| 2024 | $3,684 | $229,400 | $53,300 | $176,100 |
| 2023 | $2,881 | $169,000 | $50,700 | $118,300 |
| 2022 | $3,164 | $168,100 | $50,700 | $117,400 |
| 2021 | $3,192 | $168,900 | $46,100 | $122,800 |
| 2020 | $3,002 | $153,700 | $46,100 | $107,600 |
| 2019 | $2,887 | $146,700 | $46,100 | $100,600 |
| 2018 | $2,777 | $141,100 | $46,100 | $95,000 |
| 2017 | $2,786 | $141,700 | $46,100 | $95,600 |
| 2016 | $2,463 | $125,300 | $46,100 | $79,200 |
| 2015 | $2,390 | $121,500 | $46,100 | $75,400 |
Source: Public Records
Map
Nearby Homes
- 55 Allen St
- 19 Manor Ct Unit 19
- 125 Manor Ct Unit 125
- 101 Regal St
- 17 Pebble Mill Rd
- 206 Treetop Ave
- 120 Bridle Path Rd
- 647 Plumtree Rd
- 509 Plumtree Rd
- 86 Talmadge Dr
- 85 Talmadge Dr
- 119 Powell Ave
- 24 Wands St
- 46 Hadley St
- 37 Chesterfield Ave
- 79 Arvilla St
- 79 Roosevelt Ave
- 7 Ashbrook St
- 75 Gillette Cir
- 1088 Sumner Ave
Your Personal Tour Guide
Ask me questions while you tour the home.