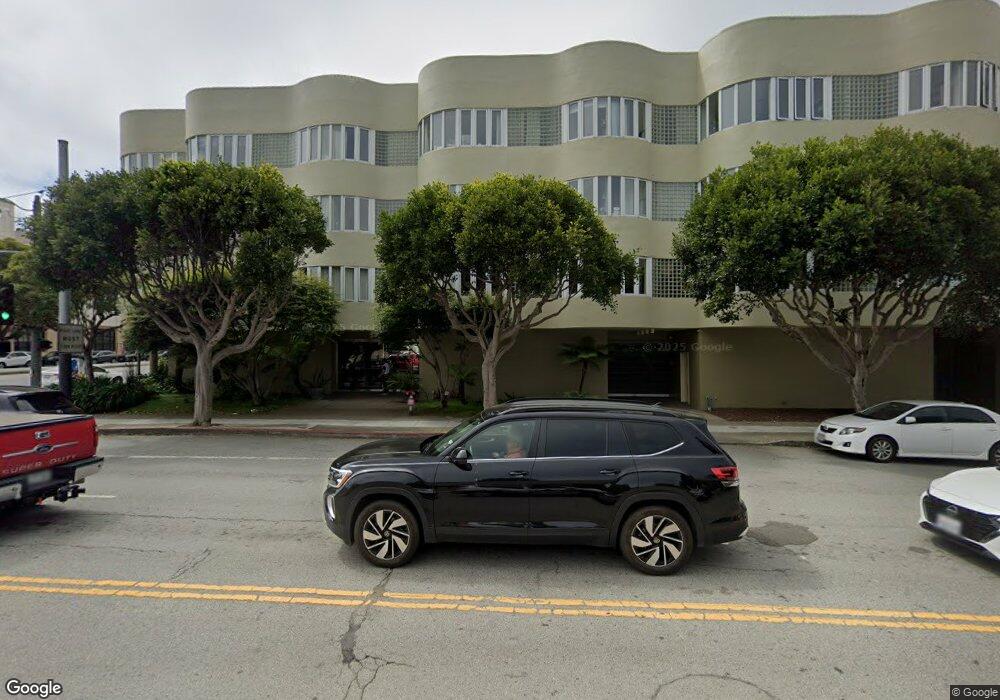
1111 Bay St Unit 406 San Francisco, CA 94123
Marina District NeighborhoodEstimated Value: $1,167,216 - $1,733,000
2
Beds
2
Baths
1,164
Sq Ft
$1,189/Sq Ft
Est. Value
About This Home
This home is located at 1111 Bay St Unit 406, San Francisco, CA 94123 and is currently estimated at $1,384,054, approximately $1,189 per square foot. 1111 Bay St Unit 406 is a home located in San Francisco County with nearby schools including Sherman Elementary, Marina Middle School, and Saint Brigid Academy.
Ownership History
Date
Name
Owned For
Owner Type
Purchase Details
Closed on
Oct 15, 2014
Sold by
Hadley Ann
Bought by
Hadley Ann M
Current Estimated Value
Purchase Details
Closed on
Jun 25, 1997
Sold by
Smith Ralph R and Windes Russel R
Bought by
Hadley Ann
Home Financials for this Owner
Home Financials are based on the most recent Mortgage that was taken out on this home.
Original Mortgage
$228,800
Outstanding Balance
$29,211
Interest Rate
6.25%
Estimated Equity
$1,354,843
Purchase Details
Closed on
Mar 18, 1996
Sold by
Graham Loran G and Graham Nancy
Bought by
Smith Ralph R and Windes Russel R
Purchase Details
Closed on
Jul 29, 1993
Sold by
Graham Loran G and Graham Nancy
Bought by
Graham Loran G and Graham Nancy
Purchase Details
Closed on
Jun 25, 1993
Sold by
Deburen Lisa
Bought by
Graham Loran G and Graham Nancy
Create a Home Valuation Report for This Property
The Home Valuation Report is an in-depth analysis detailing your home's value as well as a comparison with similar homes in the area
Home Values in the Area
Average Home Value in this Area
Purchase History
| Date | Buyer | Sale Price | Title Company |
|---|---|---|---|
| Hadley Ann M | -- | None Available | |
| Hadley Ann | $286,000 | Old Republic Title Company | |
| Smith Ralph R | $255,000 | Chicago Title Co | |
| Graham Loran G | -- | -- | |
| Graham Loran G | -- | -- |
Source: Public Records
Mortgage History
| Date | Status | Borrower | Loan Amount |
|---|---|---|---|
| Open | Hadley Ann | $228,800 |
Source: Public Records
Tax History Compared to Growth
Tax History
| Year | Tax Paid | Tax Assessment Tax Assessment Total Assessment is a certain percentage of the fair market value that is determined by local assessors to be the total taxable value of land and additions on the property. | Land | Improvement |
|---|---|---|---|---|
| 2025 | $6,894 | $535,413 | $162,856 | $372,557 |
| 2024 | $6,894 | $524,916 | $159,663 | $365,253 |
| 2023 | $6,771 | $514,625 | $156,533 | $358,092 |
| 2022 | $6,625 | $504,535 | $153,464 | $351,071 |
| 2021 | $6,503 | $494,643 | $150,455 | $344,188 |
| 2020 | $6,547 | $489,573 | $148,913 | $340,660 |
| 2019 | $6,325 | $479,975 | $145,994 | $333,981 |
| 2018 | $6,113 | $470,565 | $143,132 | $327,433 |
| 2017 | $5,741 | $461,339 | $140,326 | $321,013 |
| 2016 | $4,933 | $393,471 | $137,575 | $255,896 |
| 2015 | $4,869 | $387,562 | $135,509 | $252,053 |
| 2014 | $4,741 | $379,971 | $132,855 | $247,116 |
Source: Public Records
Map
Nearby Homes
- 1234 Francisco St Unit 5
- 1234 Francisco St Unit 4
- 1374-1376 Chestnut St
- 1345 Chestnut St
- 1050 N Point St Unit 1101
- 1050 N Point St Unit 1002
- 1000 N Point St Unit 405
- 1043 Francisco St
- 3219-3221 Gough St
- 900 N Point St Unit 411
- 900 N Point St Unit 115
- 900 N Point St Unit 619
- 900 N Point St Unit 431
- 1491 Chestnut St Unit 1491
- Terrane-N3 Plan at Norvoir
- Terrane-T1 Plan at Norvoir
- Terrane-PH Plan at Norvoir
- 915 N Point St Unit D3
- Mariner-T2 Plan at Norvoir
- 915 N Point St Unit R2
- 1111 Bay St
- 1111 Bay St Unit 405
- 1111 Bay St Unit 402
- 1111 Bay St Unit 404
- 1111 Bay St Unit 205
- 1111 Bay St Unit 203
- 1111 Bay St Unit 201
- 1111 Bay St Unit 303
- 1111 Bay St Unit 403
- 1111 Bay St Unit 401
- 1111 Bay St Unit 302
- 1111 Bay St Unit 304
- 1111 Bay St Unit 306
- 1111 Bay St Unit 307
- 1111 Bay St Unit 305
- 1111 Bay St Unit 301
- 1111 Bay St Unit 202
- 1111 Bay St Unit 204
- 1111 Bay St Unit 206
- 1111 Bay St Unit 207