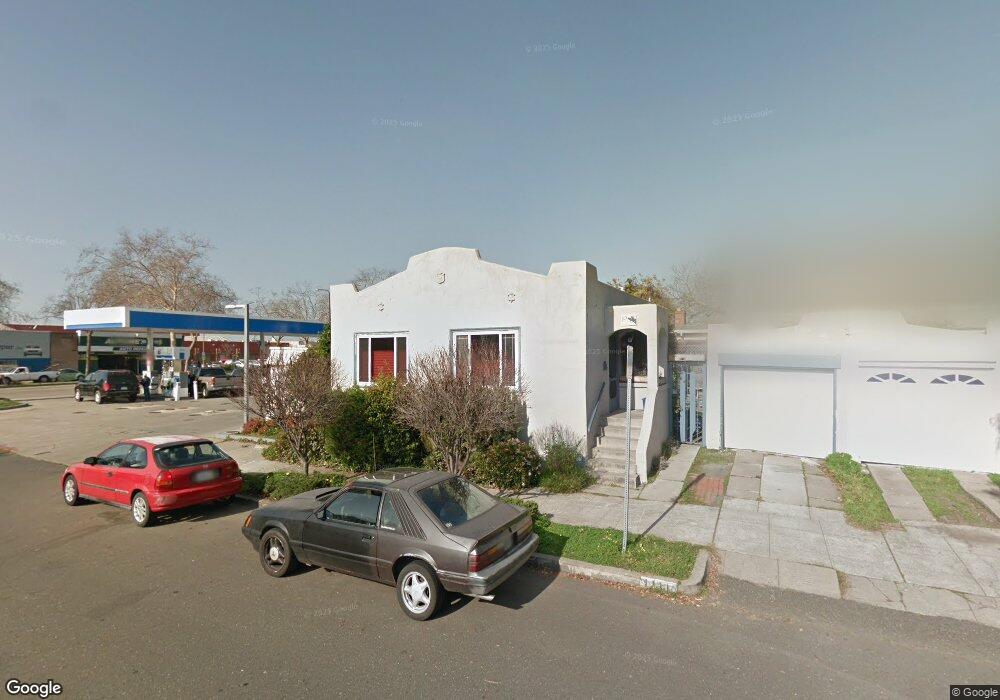
1111 Camelia St Berkeley, CA 94702
West Berkeley NeighborhoodEstimated Value: $839,000 - $1,095,000
2
Beds
1
Bath
920
Sq Ft
$1,017/Sq Ft
Est. Value
About This Home
This home is located at 1111 Camelia St, Berkeley, CA 94702 and is currently estimated at $935,490, approximately $1,016 per square foot. 1111 Camelia St is a home located in Alameda County with nearby schools including Ruth Acty Elementary, Rosa Parks Elementary School, and Thousand Oaks Elementary School.
Ownership History
Date
Name
Owned For
Owner Type
Purchase Details
Closed on
Jul 21, 2012
Sold by
Norberg Paulette Liang and Fong Donna
Bought by
Anderson Maxwell Liang
Current Estimated Value
Purchase Details
Closed on
May 18, 2009
Sold by
Liang Anderson Melanie
Bought by
Liang Anderson Melanie and The Melanie Liang Anderson Fam
Purchase Details
Closed on
Aug 11, 1995
Sold by
Cole Steven G and Martell Gayle
Bought by
Liang Anderson Melanie
Home Financials for this Owner
Home Financials are based on the most recent Mortgage that was taken out on this home.
Original Mortgage
$136,800
Interest Rate
7.71%
Create a Home Valuation Report for This Property
The Home Valuation Report is an in-depth analysis detailing your home's value as well as a comparison with similar homes in the area
Home Values in the Area
Average Home Value in this Area
Purchase History
| Date | Buyer | Sale Price | Title Company |
|---|---|---|---|
| Anderson Maxwell Liang | -- | None Available | |
| Liang Anderson Melanie | -- | None Available | |
| Liang Anderson Melanie | $152,000 | First American Title Guarant |
Source: Public Records
Mortgage History
| Date | Status | Borrower | Loan Amount |
|---|---|---|---|
| Closed | Liang Anderson Melanie | $136,800 |
Source: Public Records
Tax History
| Year | Tax Paid | Tax Assessment Tax Assessment Total Assessment is a certain percentage of the fair market value that is determined by local assessors to be the total taxable value of land and additions on the property. | Land | Improvement |
|---|---|---|---|---|
| 2025 | $5,228 | $245,495 | $75,748 | $176,747 |
| 2024 | $5,228 | $240,544 | $74,263 | $173,281 |
| 2023 | $5,044 | $242,691 | $72,807 | $169,884 |
| 2022 | $4,865 | $230,934 | $71,380 | $166,554 |
| 2021 | $4,857 | $226,268 | $69,980 | $163,288 |
| 2020 | $4,575 | $230,878 | $69,263 | $161,615 |
| 2019 | $4,361 | $226,351 | $67,905 | $158,446 |
| 2018 | $4,266 | $221,914 | $66,574 | $155,340 |
| 2017 | $4,094 | $217,564 | $65,269 | $152,295 |
| 2016 | $3,925 | $213,300 | $63,990 | $149,310 |
| 2015 | $3,862 | $210,097 | $63,029 | $147,068 |
| 2014 | $3,816 | $205,981 | $61,794 | $144,187 |
Source: Public Records
Map
Nearby Homes
- 1339 Kains Ave
- 1234 Stannage Ave
- 1213 San Pablo Ave
- 1207 Cornell Ave
- 921 Jones St
- 1114 Talbot Ave
- 1127 Key Route Blvd
- 1050 Kains Ave Unit B1(3)
- 817 Jones St
- 995 Virginia St
- 1631 Belvedere Ave
- 1120 Curtis St
- 1368 Rose St
- 1728 Curtis St
- 1136 Marin Ave
- 0 Camelia St Unit 41104882
- 1450 Fourth St Unit 5
- 1509 Francis St
- 1322 Virginia St
- 1036 Ramona Ave
- 1115 Camelia St
- 1338 Kains Ave
- 1334 Kains Ave
- 1400 Kains Ave
- 1332 Kains Ave
- 1404 Kains Ave
- 1347 Kains Ave
- 1330 Kains Ave
- 1343 Kains Ave
- 1401 Kains Ave
- 1335 Kains Ave
- 1328 Kains Ave
- 1412 Kains Ave
- 1407 Kains Ave
- 1333 Kains Ave
- 1326 Kains Ave
- 1414 Kains Ave
- 1123 Camelia St
- 1331 Kains Ave
- 1411 Kains Ave
Your Personal Tour Guide
Ask me questions while you tour the home.