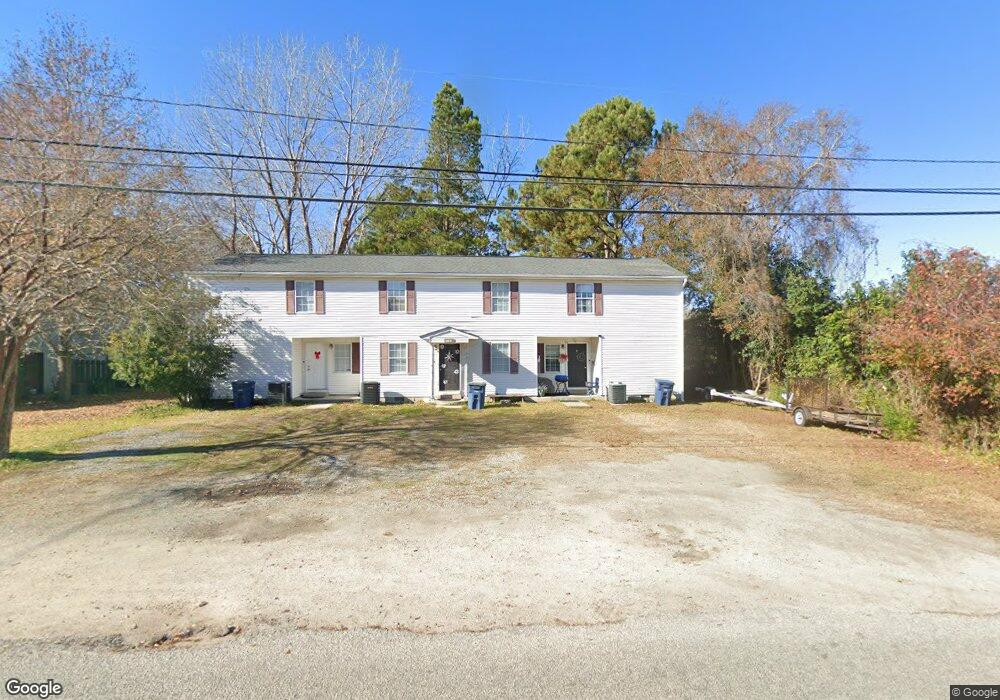
1111 Cherokee St Myrtle Beach, SC 29577
Downtown Myrtle Beach NeighborhoodEstimated Value: $321,000 - $512,000
7
Beds
4
Baths
2,596
Sq Ft
$157/Sq Ft
Est. Value
About This Home
This home is located at 1111 Cherokee St, Myrtle Beach, SC 29577 and is currently estimated at $407,236, approximately $156 per square foot. 1111 Cherokee St is a home located in Horry County with nearby schools including Myrtle Beach Child Development Center, Myrtle Beach Primary School, and Myrtle Beach Middle School.
Ownership History
Date
Name
Owned For
Owner Type
Purchase Details
Closed on
Sep 5, 2013
Sold by
Master In Equity Horry County
Bought by
Ref Inc
Current Estimated Value
Purchase Details
Closed on
Jun 15, 2005
Sold by
Steward Todd N and Steward Cheryl L
Bought by
Osborn John D
Home Financials for this Owner
Home Financials are based on the most recent Mortgage that was taken out on this home.
Original Mortgage
$29,250
Interest Rate
5.66%
Mortgage Type
Stand Alone Second
Purchase Details
Closed on
Dec 20, 2004
Sold by
Tiger Relocation Co
Bought by
Steward Todd N and Steward Cheryl L
Purchase Details
Closed on
May 6, 2004
Sold by
Barnes Robin P and Barnes Michael
Bought by
Tiger Relocation Co
Purchase Details
Closed on
May 14, 1999
Sold by
Harrington Edward B Trustee
Bought by
Barnes Robin P and Barnes Michael
Home Financials for this Owner
Home Financials are based on the most recent Mortgage that was taken out on this home.
Original Mortgage
$135,486
Interest Rate
6.84%
Mortgage Type
Purchase Money Mortgage
Create a Home Valuation Report for This Property
The Home Valuation Report is an in-depth analysis detailing your home's value as well as a comparison with similar homes in the area
Home Values in the Area
Average Home Value in this Area
Purchase History
| Date | Buyer | Sale Price | Title Company |
|---|---|---|---|
| Ref Inc | $20,001 | -- | |
| Ref Inc | $20,001 | -- | |
| Osborn John D | $195,000 | -- | |
| Steward Todd N | $159,000 | -- | |
| Tiger Relocation Co | $110,000 | -- | |
| Barnes Robin P | $136,500 | -- |
Source: Public Records
Mortgage History
| Date | Status | Borrower | Loan Amount |
|---|---|---|---|
| Previous Owner | Osborn John D | $29,250 | |
| Previous Owner | Osborn John D | $156,000 | |
| Previous Owner | Barnes Robin P | $135,486 |
Source: Public Records
Tax History
| Year | Tax Paid | Tax Assessment Tax Assessment Total Assessment is a certain percentage of the fair market value that is determined by local assessors to be the total taxable value of land and additions on the property. | Land | Improvement |
|---|---|---|---|---|
| 2025 | $3,312 | $0 | $0 | $0 |
| 2024 | $3,312 | $18,950 | $5,524 | $13,426 |
| 2023 | $3,312 | $11,315 | $4,546 | $6,769 |
| 2021 | $3,059 | $14,439 | $5,043 | $9,396 |
| 2020 | $2,917 | $14,439 | $5,043 | $9,396 |
| 2019 | $2,917 | $14,439 | $5,043 | $9,396 |
| 2018 | $0 | $11,602 | $5,716 | $5,886 |
| 2017 | $2,588 | $11,602 | $5,716 | $5,886 |
| 2016 | -- | $11,602 | $5,716 | $5,886 |
| 2015 | $2,558 | $11,602 | $5,716 | $5,886 |
| 2014 | $2,488 | $11,602 | $5,716 | $5,886 |
Source: Public Records
Map
Nearby Homes
- 1722 Saint Charles Ave
- 1733 Jacqueline Ct
- 102 Whitehaven Ct Unit 33
- 1676 Citadel Ln Unit 8
- 404 Chesterfield Ct Unit 88
- 408 Chesterfield Ct Unit 86
- 2000 Greens Blvd Unit 15C
- 2000 Greens Blvd Unit 14C
- 2000 Greens Blvd Unit 20C
- 2000 Greens Blvd Unit 28B
- 2000 Greens Blvd Unit 11 A
- 2000 Greens Blvd
- 2000 Greens Blvd Unit 10D
- 2000 Greens Blvd Unit 27A
- 300 Lyons Cove Dr
- 312 Lyons Cove Dr Unit 57
- 6025 Bolsena Place
- Tbd Carolina Forest Blvd
- Tbd Farrow Pkwy
- 2005 Greens Blvd Unit D-404
- 1111 Cherokee St Unit A
- Lot 7 Cherokee St
- Lot 15 Cherokee St
- Blk 1A Cherokee St Unit Blk 1A Cherokee Stre
- Lot 26 Cherokee St
- Lot 27 Cherokee St
- 1102 Cherokee St
- 1110 Cherokee St
- 1105 Cherokee St
- 1108 Cherokee St
- 1106 Cherokee St
- 1320 Monticello Dr
- 1103 Cherokee St Unit 1105
- 1109 Ocala St
- 1109 Ocala St Unit 3
- 1109 Ocala St Unit 4
- TBD Cherokee St
- 11 Foxcroft Ln
- 10 Foxcroft Ln
- 8 Foxcroft Ln Unit 8
Your Personal Tour Guide
Ask me questions while you tour the home.