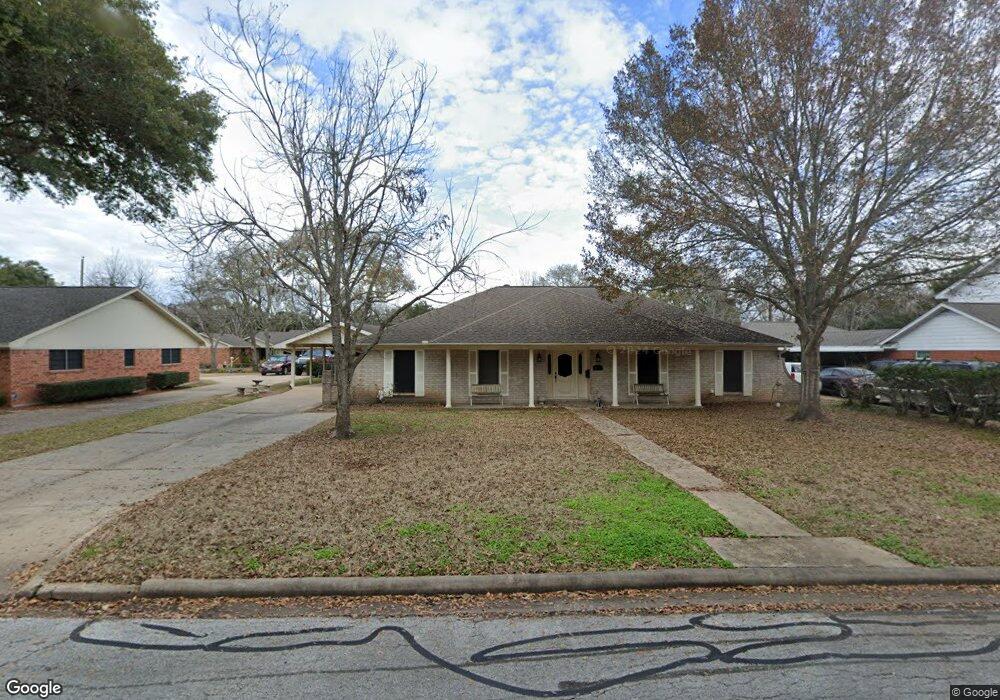
1111 Lindsey Dr Rosenberg, TX 77471
Estimated Value: $281,000 - $300,000
4
Beds
2
Baths
2,228
Sq Ft
$131/Sq Ft
Est. Value
About This Home
This home is located at 1111 Lindsey Dr, Rosenberg, TX 77471 and is currently estimated at $291,193, approximately $130 per square foot. 1111 Lindsey Dr is a home located in Fort Bend County with nearby schools including Smith Elementary School, J J Wessendorff Middle School, and Lamar Junior High School.
Ownership History
Date
Name
Owned For
Owner Type
Purchase Details
Closed on
Dec 27, 2012
Sold by
Dolezal Wayne Edward and Dolezal Josephine Lara
Bought by
Murray Josephine A
Current Estimated Value
Home Financials for this Owner
Home Financials are based on the most recent Mortgage that was taken out on this home.
Original Mortgage
$125,400
Outstanding Balance
$87,191
Interest Rate
3.37%
Mortgage Type
New Conventional
Estimated Equity
$204,002
Purchase Details
Closed on
Apr 1, 2008
Sold by
Dolezal Wayne Edward
Bought by
Dolezal Josephine Lara
Purchase Details
Closed on
Feb 21, 1996
Sold by
Johnson Kent D and Johnson Elizabeth I
Bought by
Dolezal Wayne E
Home Financials for this Owner
Home Financials are based on the most recent Mortgage that was taken out on this home.
Original Mortgage
$40,000
Interest Rate
7.01%
Create a Home Valuation Report for This Property
The Home Valuation Report is an in-depth analysis detailing your home's value as well as a comparison with similar homes in the area
Home Values in the Area
Average Home Value in this Area
Purchase History
| Date | Buyer | Sale Price | Title Company |
|---|---|---|---|
| Murray Josephine A | -- | Stewart Title | |
| Dolezal Josephine Lara | -- | Guardian Fidelity Title Co | |
| Murray Josephine A | -- | -- | |
| Dolezal Wayne E | -- | Texas American Title Company | |
| Murray Josephine A | -- | -- |
Source: Public Records
Mortgage History
| Date | Status | Borrower | Loan Amount |
|---|---|---|---|
| Open | Murray Josephine A | $125,400 | |
| Previous Owner | Murray Josephine A | $40,000 |
Source: Public Records
Tax History Compared to Growth
Tax History
| Year | Tax Paid | Tax Assessment Tax Assessment Total Assessment is a certain percentage of the fair market value that is determined by local assessors to be the total taxable value of land and additions on the property. | Land | Improvement |
|---|---|---|---|---|
| 2025 | $1,151 | $282,214 | $14,365 | $267,849 |
| 2024 | $1,151 | $310,885 | $4,790 | $306,095 |
| 2023 | $1,071 | $282,623 | $0 | $310,970 |
| 2022 | $2,365 | $256,930 | $0 | $307,050 |
| 2021 | $4,846 | $233,570 | $14,120 | $219,450 |
| 2020 | $4,507 | $212,340 | $14,120 | $198,220 |
| 2019 | $4,755 | $208,190 | $14,120 | $194,070 |
| 2018 | $4,774 | $205,700 | $14,120 | $191,580 |
| 2017 | $4,452 | $190,760 | $14,120 | $176,640 |
| 2016 | $4,048 | $173,420 | $14,120 | $159,300 |
| 2015 | $2,204 | $166,410 | $14,120 | $152,290 |
| 2014 | $2,238 | $151,280 | $14,120 | $137,160 |
Source: Public Records
Map
Nearby Homes
- 1109 Frances Dr
- 1809 Hawthorn Dr
- 1805 Hawthorn Dr
- 4602 Avenue H
- 4502 River Rd
- 1922 Teakwood St
- 1004 Country Club Dr
- 5121 Alderney Ct
- 5002 Quebec Blvd
- 5027 Quebec Blvd
- 512 and 514 Travis St
- 000 Fm 2218 Rd
- 5106 Alderney Ct
- 4707 E Parma Dr
- 1230 Law Ct
- 0 Fm 2218 Unit 25550047
- 6219 Deep Gulch Dr
- 6215 Deep Gulch Dr
- 6218 Deep Gulch Dr
- 5303 Rivers Edge Dr
- 1117 Lindsey Dr
- 1103 Lindsey Dr
- 1108 Frances Dr
- 1116 Frances Dr
- 1102 Frances Dr
- 1123 Lindsey Dr
- 1112 Lindsey Dr
- 1126 Frances Dr
- 1102 Lindsey Dr
- 1122 Lindsey Dr
- 1129 Lindsey Dr
- 1045 Lindsey Dr
- 1132 Frances Dr
- 1040 Frances Dr
- 1109 Sally Anne Dr
- 1115 Sally Anne Dr
- 1115 Frances Dr
- 1103 Sally Anne Dr
- 1046 Lindsey Dr
- 1103 Frances Dr