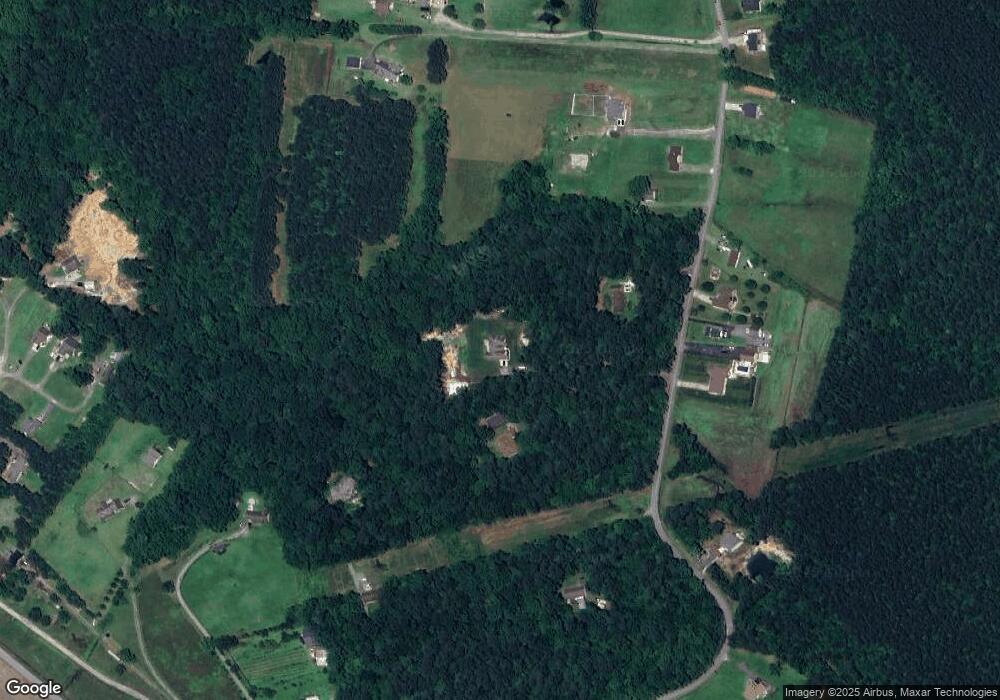
1111 Manning Rd Suffolk, VA 23434
Holy Neck NeighborhoodEstimated Value: $522,000 - $557,453
3
Beds
3
Baths
2,737
Sq Ft
$199/Sq Ft
Est. Value
About This Home
This home is located at 1111 Manning Rd, Suffolk, VA 23434 and is currently estimated at $545,484, approximately $199 per square foot. 1111 Manning Rd is a home located in Suffolk City with nearby schools including Kilby Shores Elementary School, Forest Glen Middle School, and Lakeland High School.
Ownership History
Date
Name
Owned For
Owner Type
Purchase Details
Closed on
Mar 11, 2024
Sold by
Graham James Bruce
Bought by
Graham James Bruce and Graham Velma Ann
Current Estimated Value
Purchase Details
Closed on
Mar 2, 2012
Sold by
Boone Deborah L
Bought by
Graham James B
Home Financials for this Owner
Home Financials are based on the most recent Mortgage that was taken out on this home.
Original Mortgage
$369,000
Interest Rate
3.88%
Mortgage Type
New Conventional
Create a Home Valuation Report for This Property
The Home Valuation Report is an in-depth analysis detailing your home's value as well as a comparison with similar homes in the area
Home Values in the Area
Average Home Value in this Area
Purchase History
| Date | Buyer | Sale Price | Title Company |
|---|---|---|---|
| Graham James Bruce | -- | None Listed On Document | |
| Graham James B | $90,000 | -- |
Source: Public Records
Mortgage History
| Date | Status | Borrower | Loan Amount |
|---|---|---|---|
| Previous Owner | Graham James B | $369,000 |
Source: Public Records
Tax History Compared to Growth
Tax History
| Year | Tax Paid | Tax Assessment Tax Assessment Total Assessment is a certain percentage of the fair market value that is determined by local assessors to be the total taxable value of land and additions on the property. | Land | Improvement |
|---|---|---|---|---|
| 2025 | $6,017 | $520,300 | $98,000 | $422,300 |
| 2024 | $6,017 | $479,400 | $89,100 | $390,300 |
| 2023 | $5,523 | $462,800 | $89,100 | $373,700 |
| 2022 | $4,398 | $403,500 | $89,100 | $314,400 |
| 2021 | $4,088 | $368,300 | $89,100 | $279,200 |
| 2020 | $3,873 | $348,900 | $89,100 | $259,800 |
| 2019 | $3,873 | $348,900 | $89,100 | $259,800 |
| 2018 | $3,689 | $335,500 | $74,200 | $261,300 |
| 2017 | $3,487 | $325,900 | $74,200 | $251,700 |
| 2016 | $3,383 | $316,200 | $74,200 | $242,000 |
| 2015 | $427 | $316,200 | $74,200 | $242,000 |
| 2014 | $427 | $316,200 | $74,200 | $242,000 |
Source: Public Records
Map
Nearby Homes
- 207 Beechwood Dr
- 138 Beechwood Dr
- 215 Summerfield Ct
- 118 Winterview Dr
- 3320 Jackson Rd
- 2615 Jackson Rd
- 2028 Holland Rd
- 2022 Holland Rd
- 2008 Holland Rd
- 3439 Jackson Rd
- 1505 Austin Dr
- 116 Meadows Landing Ln
- 121 Meadows Landing Ln
- 2101 Manning Rd
- 1665 Holland Rd
- 218 Mill Stream Dr
- The Poppy Plan at Edgewater
- The Persimmon Plan at Edgewater
- The Redbud Plan at Edgewater
- The Hawthorne Plan at Edgewater
- 1131 Manning Rd
- 1105 Manning Rd
- 1045 Manning Rd
- 1139 Manning Rd
- 1305 Manning Rd
- 1100 Manning Rd
- 1104 Manning Rd
- 1096 Manning Rd
- 1037 Manning Rd
- 1041 Manning Rd
- 1048 Manning Rd
- 1155 Manning Rd
- 1132 Manning Rd
- 1020 Manning Rd
- 1315 Manning Rd
- 1040 Manning Rd
- 1030 Manning Rd
- 1309 Manning Rd
- 995 Manning Rd
- 1317 Manning Rd
