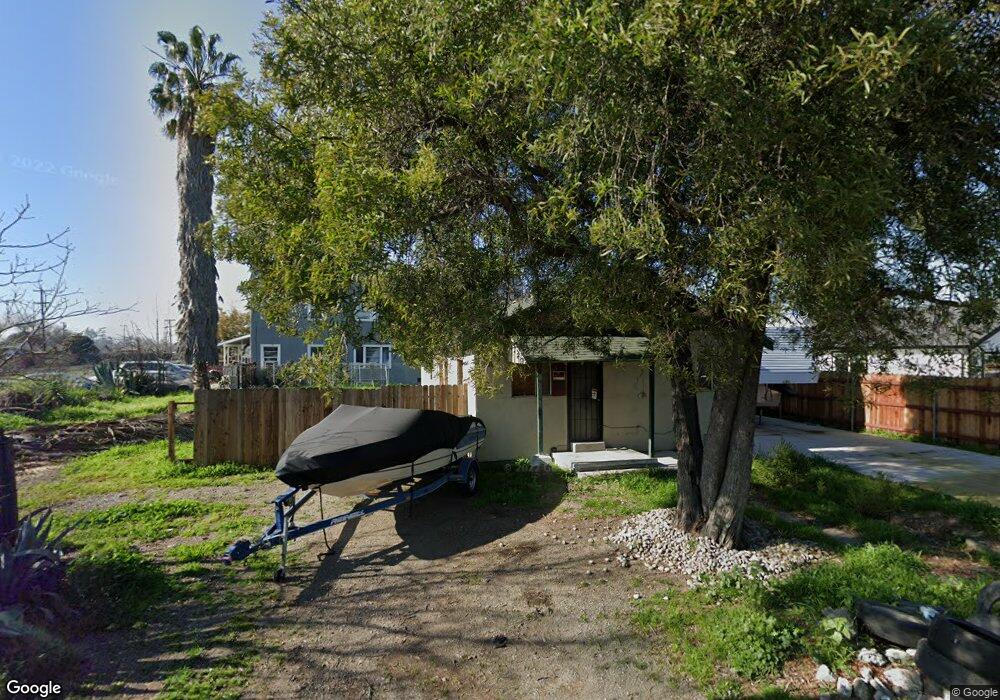
1111 N E St Stockton, CA 95205
Estimated Value: $302,000 - $544,000
4
Beds
3
Baths
862
Sq Ft
$462/Sq Ft
Est. Value
About This Home
This home is located at 1111 N E St, Stockton, CA 95205 and is currently estimated at $398,000, approximately $461 per square foot. 1111 N E St is a home located in San Joaquin County with nearby schools including John C. Fremont Elementary School, Fillmore Elementary School, and King Elementary School.
Ownership History
Date
Name
Owned For
Owner Type
Purchase Details
Closed on
Dec 5, 2024
Sold by
Burbano Florencio M and Machado Madaline G
Bought by
Burbano Samuel M
Current Estimated Value
Purchase Details
Closed on
Mar 31, 2016
Sold by
Machado Madaline G and Machado Diane M
Bought by
Machado Madaline G and Burbano Florencio M
Home Financials for this Owner
Home Financials are based on the most recent Mortgage that was taken out on this home.
Original Mortgage
$240,000
Interest Rate
3.48%
Mortgage Type
Seller Take Back
Purchase Details
Closed on
Oct 1, 2004
Sold by
Machado Yvonne C and The Restated Antonio G Machado
Bought by
Machado Yvonne C and The Restated Antonio G Machado
Purchase Details
Closed on
Jul 6, 1996
Sold by
Machado Antonio and Machado Yvonne
Bought by
Machado Antonio G and Machado Yvonne C
Create a Home Valuation Report for This Property
The Home Valuation Report is an in-depth analysis detailing your home's value as well as a comparison with similar homes in the area
Home Values in the Area
Average Home Value in this Area
Purchase History
| Date | Buyer | Sale Price | Title Company |
|---|---|---|---|
| Burbano Samuel M | -- | None Listed On Document | |
| Machado Madaline G | -- | None Available | |
| Machado Yvonne C | -- | -- | |
| Machado Antonio G | -- | -- |
Source: Public Records
Mortgage History
| Date | Status | Borrower | Loan Amount |
|---|---|---|---|
| Previous Owner | Machado Madaline G | $240,000 |
Source: Public Records
Tax History
| Year | Tax Paid | Tax Assessment Tax Assessment Total Assessment is a certain percentage of the fair market value that is determined by local assessors to be the total taxable value of land and additions on the property. | Land | Improvement |
|---|---|---|---|---|
| 2025 | $1,672 | $118,783 | $40,094 | $78,689 |
| 2024 | $1,645 | $116,455 | $39,308 | $77,147 |
| 2023 | $1,610 | $114,173 | $38,538 | $75,635 |
| 2022 | $1,507 | $111,935 | $37,783 | $74,152 |
| 2021 | $1,451 | $109,742 | $37,043 | $72,699 |
| 2020 | $1,476 | $108,618 | $36,664 | $71,954 |
| 2019 | $1,800 | $106,490 | $35,946 | $70,544 |
| 2018 | $1,480 | $104,403 | $35,242 | $69,161 |
| 2017 | $1,409 | $102,356 | $34,551 | $67,805 |
| 2016 | $941 | $62,159 | $19,273 | $42,886 |
| 2014 | $883 | $59,302 | $17,887 | $41,415 |
Source: Public Records
Map
Nearby Homes
- 1141 N E St
- 2379 E Willow St
- 2421 Hackberry St
- 1450 Belvedere Ave
- 1306 N Filbert St
- 1322 N Filbert St
- 1902 E Harding Way
- 1926 E Roosevelt St
- 1600 Sunnyside Ave
- 2731 E Anita St
- 1702 Sunnyside Ave
- 1825 N Filbert St
- 2330 Finland Ave
- 2360 Finland Ave
- 1606 Sunset Ave
- 2368 E Weber Ave
- 0 Park Unit SR25247647
- 1430 N Golden Gate Ave
- 1602 N Golden Gate Ave
- 1551 Chronicle Ave
- 2263 E Roosevelt St
- 1123 N E St
- 1110 N E St
- 1120 N E St
- 2307 E Roosevelt St
- 2249 E Roosevelt St
- 2262 E Vine St
- 2270 E Vine St
- 2317 E Roosevelt St
- 2304 E Vine St
- 2237 E Roosevelt St
- 2252 E Vine St
- 2323 E Roosevelt St
- 2245 Hackberry St
- 2318 E Vine St
- 2239 Hackberry St
- 2235 E Roosevelt St
- 2244 E Vine St
- 2233 Hackberry St
- 2303 Hackberry St
Your Personal Tour Guide
Ask me questions while you tour the home.