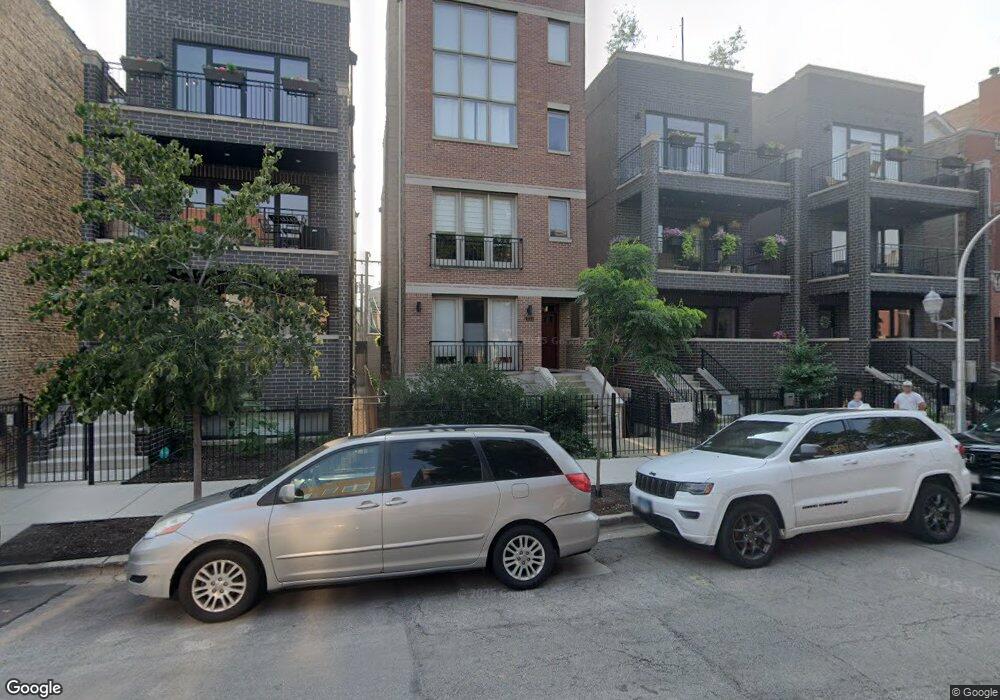
1111 N Paulina St Unit 2 Chicago, IL 60622
East Village NeighborhoodEstimated Value: $496,194 - $527,000
2
Beds
2
Baths
4,902
Sq Ft
$105/Sq Ft
Est. Value
About This Home
This home is located at 1111 N Paulina St Unit 2, Chicago, IL 60622 and is currently estimated at $513,799, approximately $104 per square foot. 1111 N Paulina St Unit 2 is a home located in Cook County with nearby schools including A.N. Pritzker School, Wells Community Academy High School, and Rowe Elementary School.
Ownership History
Date
Name
Owned For
Owner Type
Purchase Details
Closed on
Sep 30, 2016
Sold by
Brunner Joanne
Bought by
Brunner Joanne M and Joanne M Brunner Declaration Of Trust
Current Estimated Value
Purchase Details
Closed on
May 4, 2005
Sold by
Gitles Rebecca
Bought by
Brunner Joanne
Home Financials for this Owner
Home Financials are based on the most recent Mortgage that was taken out on this home.
Original Mortgage
$260,000
Outstanding Balance
$125,960
Interest Rate
4.75%
Mortgage Type
Unknown
Estimated Equity
$387,839
Purchase Details
Closed on
Nov 30, 1999
Sold by
American National Bk & Tr Co Of Chicago
Bought by
Gitles Rebecca E
Home Financials for this Owner
Home Financials are based on the most recent Mortgage that was taken out on this home.
Original Mortgage
$203,500
Interest Rate
7.81%
Create a Home Valuation Report for This Property
The Home Valuation Report is an in-depth analysis detailing your home's value as well as a comparison with similar homes in the area
Home Values in the Area
Average Home Value in this Area
Purchase History
| Date | Buyer | Sale Price | Title Company |
|---|---|---|---|
| Brunner Joanne M | -- | Attorney | |
| Brunner Joanne | $344,000 | Pntn | |
| Gitles Rebecca E | $226,000 | -- |
Source: Public Records
Mortgage History
| Date | Status | Borrower | Loan Amount |
|---|---|---|---|
| Open | Brunner Joanne | $260,000 | |
| Previous Owner | Gitles Rebecca E | $203,500 |
Source: Public Records
Tax History Compared to Growth
Tax History
| Year | Tax Paid | Tax Assessment Tax Assessment Total Assessment is a certain percentage of the fair market value that is determined by local assessors to be the total taxable value of land and additions on the property. | Land | Improvement |
|---|---|---|---|---|
| 2024 | $6,163 | $34,004 | $6,187 | $27,817 |
| 2023 | $5,969 | $32,440 | $2,418 | $30,022 |
| 2022 | $5,969 | $32,440 | $2,418 | $30,022 |
| 2021 | $5,854 | $32,439 | $2,417 | $30,022 |
| 2020 | $4,948 | $25,313 | $2,417 | $22,896 |
| 2019 | $4,868 | $27,660 | $2,417 | $25,243 |
| 2018 | $4,785 | $27,660 | $2,417 | $25,243 |
| 2017 | $4,692 | $25,172 | $2,133 | $23,039 |
| 2016 | $4,542 | $25,172 | $2,133 | $23,039 |
| 2015 | $4,132 | $25,172 | $2,133 | $23,039 |
| 2014 | $3,347 | $20,606 | $1,813 | $18,793 |
| 2013 | $3,269 | $20,606 | $1,813 | $18,793 |
Source: Public Records
Map
Nearby Homes
- 1213 N Paulina St
- 1222 N Paulina St
- 629 N Ashland Ave
- 1232 N Milwaukee Ave Unit 2
- 1234 N Milwaukee Ave Unit 3
- 1258 N Milwaukee Ave Unit 3N
- 2405 W Iowa St Unit 405
- 1035 N Hermitage Ave Unit 3
- 1057 N Wood St Unit 1
- 1015 N Hermitage Ave Unit C
- 1636 W Augusta Blvd
- 1509 W Thomas St
- 1002 N Wood St
- 1013 N Honore St Unit 1
- 1215 N Greenview Ave Unit 1E
- 1019 N Wolcott Ave
- 878 N Marshfield Ave Unit 1
- 1119 N Winchester Ave Unit 2
- 867 N Marshfield Ave Unit 2
- 1029 N Winchester Ave
- 1111 N Paulina St Unit 3
- 1111 N Paulina St Unit 1
- 1107 N Paulina St Unit 1
- 1107 N Paulina St Unit 3
- 1107 N Paulina St Unit 2
- 1117 N Paulina St
- 1115 N Paulina St Unit 1
- 1115 N Paulina St Unit 3
- 1115 N Paulina St Unit 2
- 1109 N Paulina St
- 1109 N Paulina St Unit 1
- 1109 N Paulina St Unit 3
- 1109 N Paulina St Unit 2
- 1103 N Paulina St Unit 3
- 1103 N Paulina St Unit 1
- 1103 N Paulina St
- 1119 N Paulina St
- 1112 N Marshfield Ave
- 1112 N Marshfield Ave Unit M02B
- 1112 N Marshfield Ave