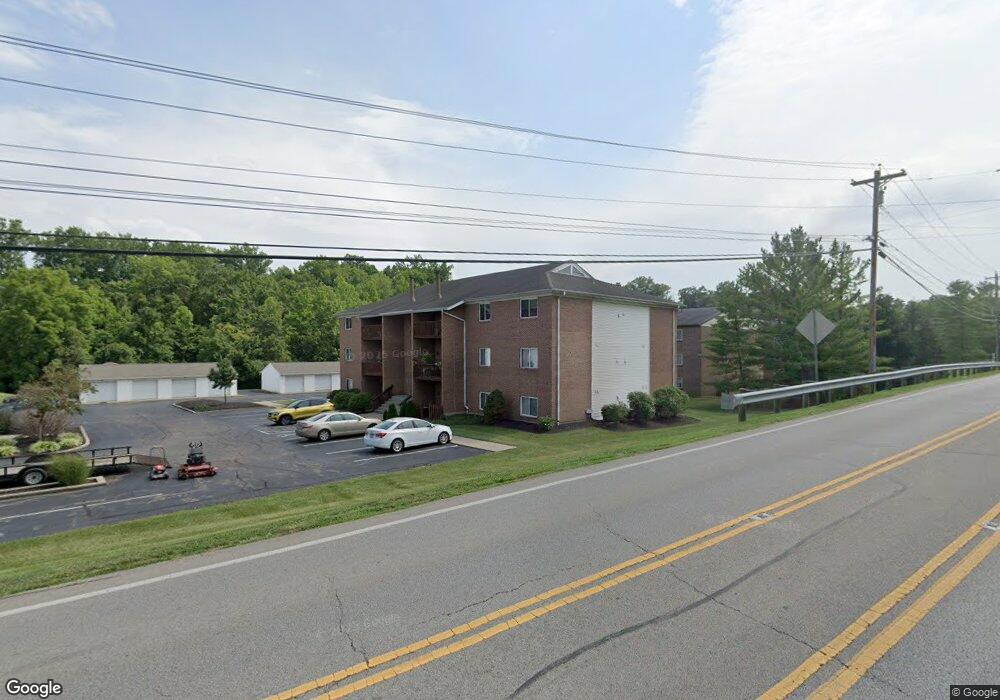
1111 Shayler Rd Unit 9 Batavia, OH 45103
Estimated Value: $155,000 - $197,000
2
Beds
2
Baths
1,039
Sq Ft
$162/Sq Ft
Est. Value
About This Home
This home is located at 1111 Shayler Rd Unit 9, Batavia, OH 45103 and is currently estimated at $168,267, approximately $161 per square foot. 1111 Shayler Rd Unit 9 is a home located in Clermont County with nearby schools including Clough Pike Elementary School, West Clermont Middle School, and West Clermont High School.
Ownership History
Date
Name
Owned For
Owner Type
Purchase Details
Closed on
Sep 11, 2023
Sold by
Beamer Jodi
Bought by
Obermeyer Marisa
Current Estimated Value
Home Financials for this Owner
Home Financials are based on the most recent Mortgage that was taken out on this home.
Original Mortgage
$7,750
Outstanding Balance
$7,584
Interest Rate
6.9%
Estimated Equity
$160,683
Purchase Details
Closed on
Aug 3, 2000
Sold by
Hutchens Donald J
Bought by
Beamer Jodi
Home Financials for this Owner
Home Financials are based on the most recent Mortgage that was taken out on this home.
Original Mortgage
$61,595
Interest Rate
8.19%
Mortgage Type
FHA
Purchase Details
Closed on
Dec 4, 1998
Sold by
Boeddeker Robert A
Bought by
Hutchens Donald J
Home Financials for this Owner
Home Financials are based on the most recent Mortgage that was taken out on this home.
Original Mortgage
$54,900
Interest Rate
6.8%
Mortgage Type
New Conventional
Purchase Details
Closed on
Mar 20, 1991
Create a Home Valuation Report for This Property
The Home Valuation Report is an in-depth analysis detailing your home's value as well as a comparison with similar homes in the area
Home Values in the Area
Average Home Value in this Area
Purchase History
| Date | Buyer | Sale Price | Title Company |
|---|---|---|---|
| Obermeyer Marisa | $155,000 | None Listed On Document | |
| Beamer Jodi | $63,500 | -- | |
| Hutchens Donald J | $59,000 | -- | |
| -- | $50,900 | -- |
Source: Public Records
Mortgage History
| Date | Status | Borrower | Loan Amount |
|---|---|---|---|
| Open | Obermeyer Marisa | $7,750 | |
| Open | Obermeyer Marisa | $147,250 | |
| Previous Owner | Beamer Jodi | $61,595 | |
| Previous Owner | Hutchens Donald J | $54,900 |
Source: Public Records
Tax History Compared to Growth
Tax History
| Year | Tax Paid | Tax Assessment Tax Assessment Total Assessment is a certain percentage of the fair market value that is determined by local assessors to be the total taxable value of land and additions on the property. | Land | Improvement |
|---|---|---|---|---|
| 2024 | $2,013 | $39,910 | $6,410 | $33,500 |
| 2023 | $2,016 | $39,910 | $6,410 | $33,500 |
| 2022 | $1,528 | $26,220 | $4,200 | $22,020 |
| 2021 | $1,534 | $26,220 | $4,200 | $22,020 |
| 2020 | $1,536 | $26,220 | $4,200 | $22,020 |
| 2019 | $930 | $18,560 | $2,000 | $16,560 |
| 2018 | $939 | $18,560 | $2,000 | $16,560 |
| 2017 | $952 | $18,560 | $2,000 | $16,560 |
| 2016 | $918 | $16,420 | $1,750 | $14,670 |
| 2015 | $891 | $16,420 | $1,750 | $14,670 |
| 2014 | $891 | $16,420 | $1,750 | $14,670 |
| 2013 | $1,164 | $21,220 | $1,510 | $19,710 |
Source: Public Records
Map
Nearby Homes
- 1105 Ridgepointe Dr
- 4225 English Oaks Ct
- 1094 Valley Wood Dr
- 1097 Stone Oak Blvd
- 1079 Valley Wood Dr
- 1055 Valley Wood Dr
- 4271 Wellington Dr
- 1184 Creekstone Dr
- 1194 Meadow Knoll Ct
- 1195 Shayler Woods Dr
- 943 London Ct
- Wesley Plan at Silverstone - Maple Street Collection
- Jensen Plan at Buxton Oaks - Maple Street Collection
- Fairfax Plan at Silverstone - Maple Street Collection
- Danville Plan at Buxton Oaks - Maple Street Collection
- Cumberland Plan at Silverstone - Maple Street Collection
- Breckenridge Plan at Buxton Oaks - Maple Street Collection
- Wesley Plan at Buxton Oaks - Maple Street Collection
- Breckenridge Plan at Silverstone - Maple Street Collection
- Beacon Plan at Buxton Oaks - Maple Street Collection
- 1111 Shayler Rd Unit 1
- 1111 Shayler Rd Unit 8
- 1111 Shayler Rd Unit 11
- 1111 Shayler Rd Unit 10
- 1111 Shayler Rd
- 1111 Shayler Rd
- 1111 Shayler Rd
- 1111 Shayler Rd
- 1111 Shayler Rd Unit 13G
- 1111 Shayler Rd
- 1111 Shayler Rd Unit 3
- 1111 Shayler Rd
- 1111 Shayler Rd Unit 6
- 1111 Shayler Rd Unit 3
- 1111 Shayler Rd Unit 4
- 1111 Shayler Rd Unit 2
- 1111 Shayler Rd Unit 5
- 1111 Shayler Rd Unit 12
- 1111 Shayler Rd Unit 7
- 1111 Shayler Rd