1111 Sheridan Rd Winnetka, IL 60093
Estimated Value: $4,067,000 - $6,251,539
5
Beds
6
Baths
7,500
Sq Ft
$688/Sq Ft
Est. Value
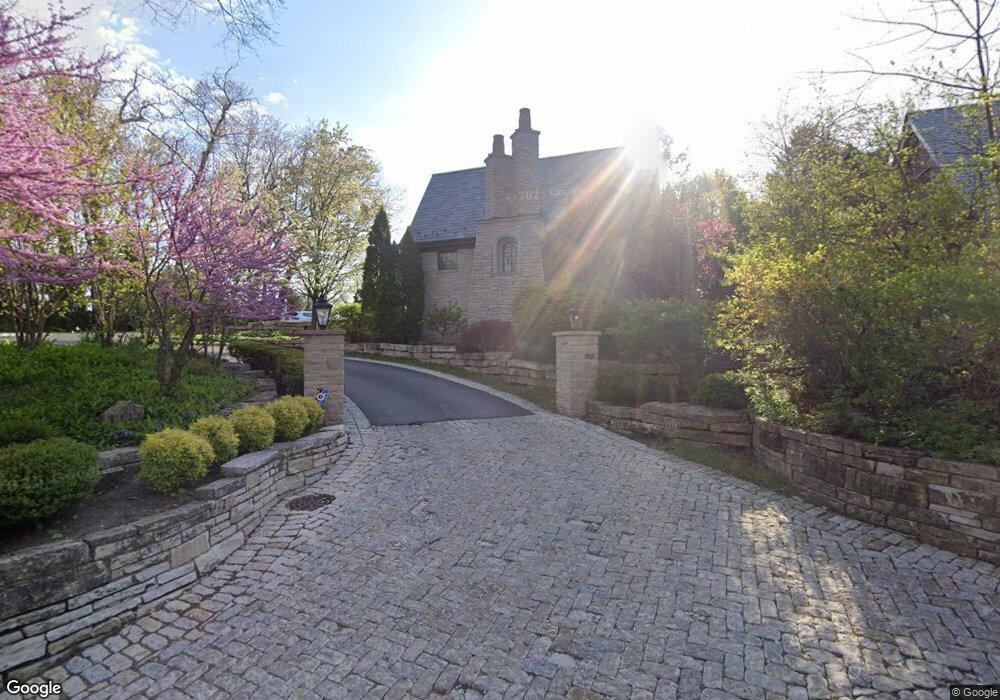
About This Home
This home is located at 1111 Sheridan Rd, Winnetka, IL 60093 and is currently estimated at $5,159,270, approximately $687 per square foot. 1111 Sheridan Rd is a home located in Cook County with nearby schools including Hubbard Woods Elementary School, The Skokie School, and The Carleton W. Washburne School.
Ownership History
Date
Name
Owned For
Owner Type
Purchase Details
Closed on
Oct 12, 2011
Sold by
Chase Robert M
Bought by
2011 Residential Group Llc
Current Estimated Value
Home Financials for this Owner
Home Financials are based on the most recent Mortgage that was taken out on this home.
Original Mortgage
$3,000,000
Outstanding Balance
$2,036,223
Interest Rate
4%
Mortgage Type
New Conventional
Estimated Equity
$3,123,047
Purchase Details
Closed on
Oct 10, 2007
Sold by
Chase Robert Merrill and Chase Moya F
Bought by
Chase Robert M and Chase Moya F
Purchase Details
Closed on
Sep 2, 1993
Sold by
Chase Robert Merrill and Chase Moya F
Bought by
Chase Robert Merrill and Chase Moya F
Create a Home Valuation Report for This Property
The Home Valuation Report is an in-depth analysis detailing your home's value as well as a comparison with similar homes in the area
Home Values in the Area
Average Home Value in this Area
Purchase History
| Date | Buyer | Sale Price | Title Company |
|---|---|---|---|
| 2011 Residential Group Llc | $4,500,000 | Ct | |
| 2011 Residential Group Llc | $4,500,000 | Ct | |
| Chase Robert M | -- | None Available | |
| Chase Robert Merrill | -- | -- |
Source: Public Records
Mortgage History
| Date | Status | Borrower | Loan Amount |
|---|---|---|---|
| Open | 2011 Residential Group Llc | $3,000,000 | |
| Closed | 2011 Residential Group Llc | $3,000,000 |
Source: Public Records
Tax History Compared to Growth
Tax History
| Year | Tax Paid | Tax Assessment Tax Assessment Total Assessment is a certain percentage of the fair market value that is determined by local assessors to be the total taxable value of land and additions on the property. | Land | Improvement |
|---|---|---|---|---|
| 2024 | $205,098 | $887,997 | $312,325 | $575,672 |
| 2023 | $205,433 | $887,997 | $312,325 | $575,672 |
| 2022 | $205,433 | $944,678 | $312,325 | $632,353 |
| 2021 | $185,370 | $717,600 | $343,557 | $374,043 |
| 2020 | $183,268 | $717,600 | $343,557 | $374,043 |
| 2019 | $181,890 | $780,000 | $343,557 | $436,443 |
| 2018 | $171,624 | $715,523 | $274,846 | $440,677 |
| 2017 | $166,326 | $715,523 | $274,846 | $440,677 |
| 2016 | $158,414 | $715,523 | $274,846 | $440,677 |
| 2015 | $170,710 | $693,841 | $249,860 | $443,981 |
| 2014 | $60,155 | $249,860 | $249,860 | $0 |
| 2013 | $57,376 | $249,860 | $249,860 | $0 |
Source: Public Records
Map
Nearby Homes
- 1015 Sheridan Rd
- 205 Scott Ave
- 150 Linden Ave
- 979 Vine St
- 1235 Scott Ave
- 943 Westmoor Rd
- 265 Randolph St
- 410 Green Bay Rd
- 650 Winnetka Mews Unit 310
- 630 Winnetka Mews Unit 402
- 560 Drexel Ave
- 1295 Sunview Ln
- 1492 Asbury Ave
- 1288 Sunview Ln
- 590 Green Bay Rd Unit 590
- 313 Hawthorn Ave Unit 313F
- 1 Briar Ln
- 677 Greenleaf Ave
- 764 Boal Pkwy
- 455 Sheridan Rd
- 1085 Sheridan Rd
- 1091 Sheridan Rd
- 1119 Sheridan Rd
- 1077 Sheridan Rd
- 1091 Fisher Ln
- 1133 Taylorsport Ln
- 1094 Fisher Ln
- 1072 Fisher Ln
- 1127 Sheridan Rd
- 919 Fisher Ln
- 1134 Taylorsport Ln
- 1134 Taylorsport Ln
- 1134 Taylorsport Ln
- 1134 Taylorsport Ln
- 1131 Taylorsport Ln
- 921 Fisher Ln
- 1096 Fisher Ln
- 1093 Fisher Ln
- 1129 Taylorsport Ln
- 915 Fisher Ln