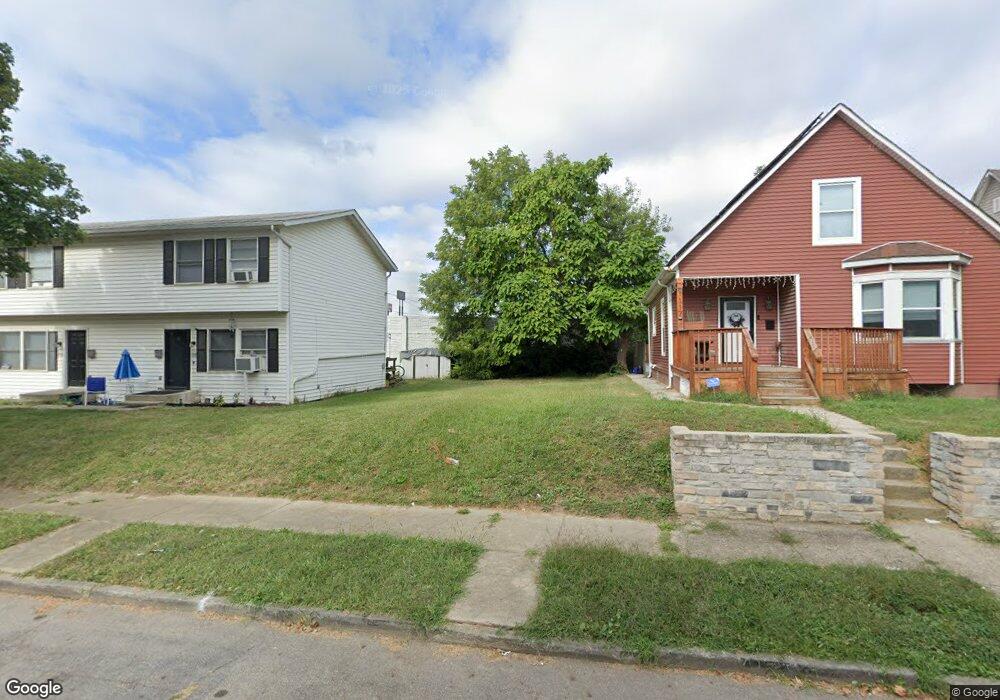
1111 Sidney St Unit 113 Columbus, OH 43201
Milo-Grogan NeighborhoodEstimated Value: $39,000 - $192,000
4
Beds
2
Baths
1,890
Sq Ft
$63/Sq Ft
Est. Value
About This Home
This home is located at 1111 Sidney St Unit 113, Columbus, OH 43201 and is currently estimated at $118,667, approximately $62 per square foot. 1111 Sidney St Unit 113 is a home located in Franklin County with nearby schools including Windsor Stem Acadmey, Linden-Mckinley Stem School On Arcadia, and Columbus Performance Academy.
Ownership History
Date
Name
Owned For
Owner Type
Purchase Details
Closed on
Sep 18, 2023
Sold by
Parks Debra
Bought by
Aca Repairs Llc
Current Estimated Value
Purchase Details
Closed on
Aug 17, 2022
Sold by
Central Ohio Community Improvement Corp
Bought by
City Of Columbus Ohio
Purchase Details
Closed on
Jul 19, 2022
Sold by
City Of Columbus Ohio
Bought by
Parks Debra
Purchase Details
Closed on
Oct 13, 2021
Sold by
Franklin County
Bought by
Central Ohio Community Improvement Corp
Purchase Details
Closed on
Oct 23, 2012
Sold by
Furgan Yathrun A
Bought by
Dillow Rebecca J
Purchase Details
Closed on
Dec 30, 2011
Sold by
Furqan Muntaqima
Bought by
Furqan Yathrun A
Purchase Details
Closed on
Oct 31, 2003
Sold by
Previn Enterprises Llc
Bought by
Furqan Yathrun A and Furquan Muntaqima
Create a Home Valuation Report for This Property
The Home Valuation Report is an in-depth analysis detailing your home's value as well as a comparison with similar homes in the area
Home Values in the Area
Average Home Value in this Area
Purchase History
| Date | Buyer | Sale Price | Title Company |
|---|---|---|---|
| Aca Repairs Llc | $4,300 | None Listed On Document | |
| City Of Columbus Ohio | -- | -- | |
| Parks Debra | -- | None Listed On Document | |
| Central Ohio Community Improvement Corp | -- | None Available | |
| Dillow Rebecca J | $1,000 | None Available | |
| Furqan Yathrun A | -- | None Available | |
| Furqan Yathrun A | $30,500 | -- |
Source: Public Records
Mortgage History
| Date | Status | Borrower | Loan Amount |
|---|---|---|---|
| Closed | Furqan Yathrun A | $0 |
Source: Public Records
Tax History
| Year | Tax Paid | Tax Assessment Tax Assessment Total Assessment is a certain percentage of the fair market value that is determined by local assessors to be the total taxable value of land and additions on the property. | Land | Improvement |
|---|---|---|---|---|
| 2025 | $250 | $2,630 | $2,630 | -- |
| 2024 | $250 | $2,630 | $2,630 | -- |
| 2023 | $119 | $2,630 | $2,630 | $0 |
| 2022 | $0 | $1,510 | $1,510 | $0 |
| 2021 | $5,163 | $1,510 | $1,510 | $0 |
Source: Public Records
Map
Nearby Homes
- 1025 Howard St
- 780-782 Gibbard Ave
- 997-999 Gibbard Ave
- 276 E 4th Ave
- 923 Camden Ave
- 927 Camden Ave
- 650 E 3rd Ave
- 773-775 E 3rd Ave
- 663 E 2nd Ave
- 841 Saint Clair Ave
- 661 E 11th Ave
- 1449 Jefferson Ave
- 0 Leona Ave
- 1222 N Grant Ave Unit H
- 472 Reynolds Ave Unit 474
- 1233 Cromartie Ln
- 1239 Cromartie Ln
- 957 E 12th Ave
- 1538-1542 Accommodation Ave
- 1291 N Grant Ave
- 1111 Sidney St
- 1117 Sidney St
- 1107 Sidney St Unit 109
- 1121 Sidney St
- 1123 Sidney St
- 1123-1129 Sidney St
- 1108 Sidney St Unit 110
- 1112 Sidney St
- 1116 Sidney St
- 1120 Sidney St
- 1104 Sidney St
- 1128 Sidney St
- 1124 Sidney St Unit 126
- 1100 Sidney St
- 1139 Sidney St
- 1096 Sidney St
- 1092 Sidney St
- 1141 Sidney St
- 1088 Sidney St
- 1138 Sidney St
Your Personal Tour Guide
Ask me questions while you tour the home.