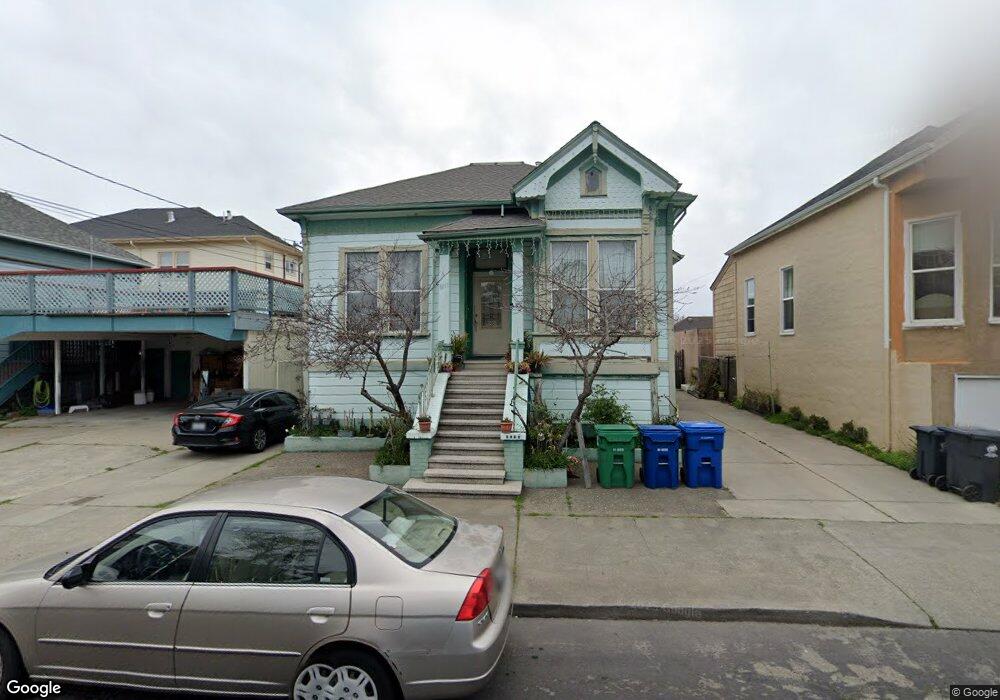
1111 Walnut St Alameda, CA 94501
South Shore NeighborhoodEstimated Value: $1,072,000 - $1,238,243
4
Beds
2
Baths
1,536
Sq Ft
$738/Sq Ft
Est. Value
About This Home
This home is located at 1111 Walnut St, Alameda, CA 94501 and is currently estimated at $1,133,811, approximately $738 per square foot. 1111 Walnut St is a home located in Alameda County with nearby schools including Love Elementary, Will C. Wood Middle School, and Alameda High School.
Ownership History
Date
Name
Owned For
Owner Type
Purchase Details
Closed on
Dec 29, 2017
Sold by
Tang Jenny H and Tang Vu C
Bought by
Tang Jenny H and Tran Lily H
Current Estimated Value
Purchase Details
Closed on
Jun 27, 2015
Sold by
Vo Hao H
Bought by
Tang Jenny H
Purchase Details
Closed on
Jun 22, 2015
Sold by
Tran Hue T and Tang Jenny H
Bought by
Tang Jenny H and Tang Vu C
Purchase Details
Closed on
Oct 1, 2002
Sold by
Tran Hue T and Tang Jenny H
Bought by
Tran Hue T and Tang Jenny H
Home Financials for this Owner
Home Financials are based on the most recent Mortgage that was taken out on this home.
Original Mortgage
$300,000
Interest Rate
6.17%
Purchase Details
Closed on
Mar 13, 2001
Sold by
Tran Lam T
Bought by
Tang Jenny H
Home Financials for this Owner
Home Financials are based on the most recent Mortgage that was taken out on this home.
Original Mortgage
$296,000
Interest Rate
7.11%
Purchase Details
Closed on
Mar 5, 2001
Sold by
Garcia Norman M and Garcia Luz M
Bought by
Tran Hue T and Tang Jenny H
Home Financials for this Owner
Home Financials are based on the most recent Mortgage that was taken out on this home.
Original Mortgage
$296,000
Interest Rate
7.11%
Create a Home Valuation Report for This Property
The Home Valuation Report is an in-depth analysis detailing your home's value as well as a comparison with similar homes in the area
Home Values in the Area
Average Home Value in this Area
Purchase History
| Date | Buyer | Sale Price | Title Company |
|---|---|---|---|
| Tang Jenny H | -- | None Available | |
| Tang Jenny H | -- | None Available | |
| Tang Jenny H | -- | None Available | |
| Tran Hue T | -- | Alliance Title Company | |
| Tang Jenny H | -- | North American Title Co | |
| Tran Hue T | $370,000 | North American Title Co |
Source: Public Records
Mortgage History
| Date | Status | Borrower | Loan Amount |
|---|---|---|---|
| Previous Owner | Tran Hue T | $300,000 | |
| Previous Owner | Tran Hue T | $296,000 |
Source: Public Records
Tax History
| Year | Tax Paid | Tax Assessment Tax Assessment Total Assessment is a certain percentage of the fair market value that is determined by local assessors to be the total taxable value of land and additions on the property. | Land | Improvement |
|---|---|---|---|---|
| 2025 | $9,083 | $550,490 | $167,247 | $390,243 |
| 2024 | $9,083 | $539,560 | $163,968 | $382,592 |
| 2023 | $8,751 | $535,844 | $160,753 | $375,091 |
| 2022 | $8,554 | $518,340 | $157,602 | $367,738 |
| 2021 | $8,349 | $508,040 | $154,512 | $360,528 |
| 2020 | $8,243 | $509,760 | $152,928 | $356,832 |
| 2019 | $7,716 | $499,765 | $149,929 | $349,836 |
| 2018 | $7,525 | $489,968 | $146,990 | $342,978 |
| 2017 | $7,199 | $480,363 | $144,109 | $336,254 |
| 2016 | $7,190 | $470,946 | $141,284 | $329,662 |
| 2015 | $7,156 | $463,875 | $139,162 | $324,713 |
| 2014 | $6,890 | $454,792 | $136,437 | $318,355 |
Source: Public Records
Map
Nearby Homes
- 2118 Alameda Ave
- 2050 Central Ave
- 2312 San Antonio Ave
- 1251 Park St
- 1241 Park Ave
- 2417 Marti Rae Ct
- 2137 Otis Dr Unit 111
- 976 Park St
- 2000 Clinton Ave
- 2031 Otis Dr Unit H
- 954 Park St
- 2106 Otis Dr Unit A
- 2136 Pacific Ave
- 1100 Park Ave
- 2515 Central Ave Unit 203
- 1822 Clinton Ave
- 2608 Central Ave
- 610 Grand St
- 2101 Shoreline Dr Unit 153
- 2101 Shoreline Dr Unit 475
- 2171 San Antonio Ave
- 2169 San Antonio Ave
- 2161 San Antonio Ave
- 2164 Encinal Ave
- 1100 Walnut St
- 2160 Encinal Ave
- 2157 San Antonio Ave
- 2203 San Antonio Ave
- 2200 Encinal Ave
- 2158 Encinal Ave
- 1114 Walnut St
- 2156 Encinal Ave
- 2205 San Antonio Ave Unit G
- 2205 San Antonio Ave Unit F
- 2205 San Antonio Ave Unit E
- 2205 San Antonio Ave Unit D
- 2205 San Antonio Ave Unit C
- 2205 San Antonio Ave Unit B
- 2205 San Antonio Ave Unit A
- 2206 Encinal Ave
Your Personal Tour Guide
Ask me questions while you tour the home.