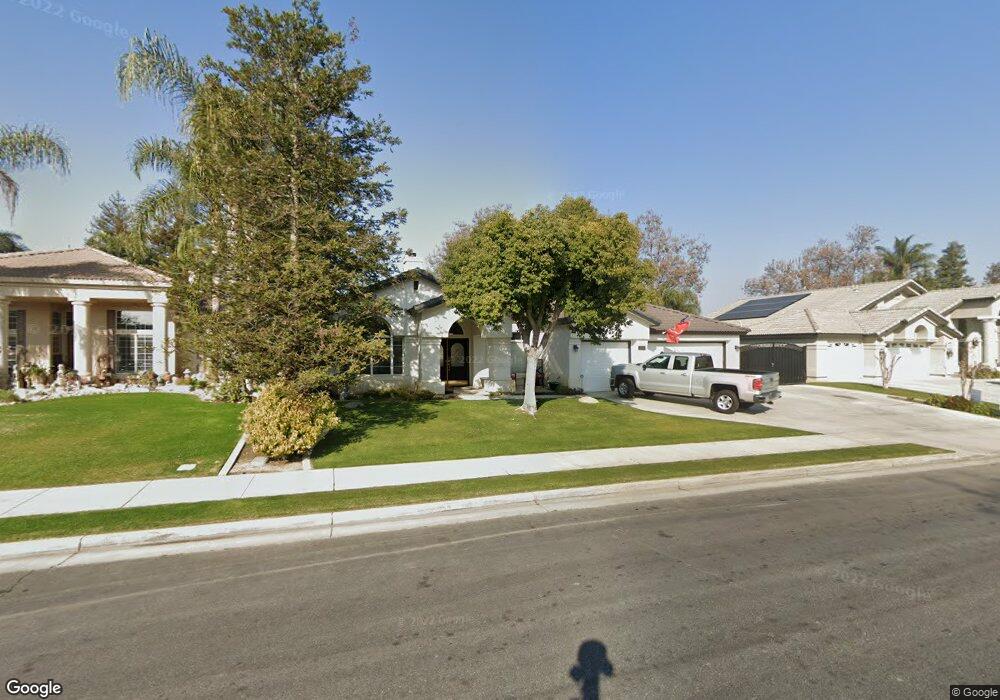
11110 Iron Creek Ave Bakersfield, CA 93312
Brighton NeighborhoodEstimated Value: $550,162 - $572,000
4
Beds
2
Baths
2,249
Sq Ft
$250/Sq Ft
Est. Value
About This Home
This home is located at 11110 Iron Creek Ave, Bakersfield, CA 93312 and is currently estimated at $561,291, approximately $249 per square foot. 11110 Iron Creek Ave is a home located in Kern County with nearby schools including American Elementary School, Rosedale Middle School, and Liberty High School.
Ownership History
Date
Name
Owned For
Owner Type
Purchase Details
Closed on
Jul 31, 2003
Sold by
Moulton Jeffrey and Moulton Bethany
Bought by
Hidalgo Larry and Hidalgo Rosanne
Current Estimated Value
Home Financials for this Owner
Home Financials are based on the most recent Mortgage that was taken out on this home.
Original Mortgage
$247,809
Outstanding Balance
$112,612
Interest Rate
6.06%
Mortgage Type
VA
Estimated Equity
$448,679
Purchase Details
Closed on
Sep 27, 2000
Sold by
Bha Properties Llc
Bought by
Probuilt Development & Construction Inc
Home Financials for this Owner
Home Financials are based on the most recent Mortgage that was taken out on this home.
Original Mortgage
$168,943
Interest Rate
8.01%
Purchase Details
Closed on
Sep 25, 2000
Sold by
Probuilt Development & Construction Inc
Bought by
Moulton Jeffrey and Moulton Bethany
Home Financials for this Owner
Home Financials are based on the most recent Mortgage that was taken out on this home.
Original Mortgage
$168,943
Interest Rate
8.01%
Create a Home Valuation Report for This Property
The Home Valuation Report is an in-depth analysis detailing your home's value as well as a comparison with similar homes in the area
Home Values in the Area
Average Home Value in this Area
Purchase History
| Date | Buyer | Sale Price | Title Company |
|---|---|---|---|
| Hidalgo Larry | $270,000 | Commonwealth Title | |
| Probuilt Development & Construction Inc | $35,000 | American Title Co | |
| Moulton Jeffrey | $188,000 | -- |
Source: Public Records
Mortgage History
| Date | Status | Borrower | Loan Amount |
|---|---|---|---|
| Open | Hidalgo Larry | $247,809 | |
| Previous Owner | Moulton Jeffrey | $168,943 |
Source: Public Records
Tax History Compared to Growth
Tax History
| Year | Tax Paid | Tax Assessment Tax Assessment Total Assessment is a certain percentage of the fair market value that is determined by local assessors to be the total taxable value of land and additions on the property. | Land | Improvement |
|---|---|---|---|---|
| 2025 | $5,958 | $410,648 | $59,704 | $350,944 |
| 2024 | $5,843 | $402,597 | $58,534 | $344,063 |
| 2023 | $5,843 | $394,705 | $57,387 | $337,318 |
| 2022 | $5,743 | $386,967 | $56,262 | $330,705 |
| 2021 | $5,579 | $379,381 | $55,159 | $324,222 |
| 2020 | $5,519 | $375,493 | $54,594 | $320,899 |
| 2019 | $5,386 | $375,493 | $54,594 | $320,899 |
| 2018 | $5,263 | $360,916 | $52,475 | $308,441 |
| 2017 | $5,205 | $353,841 | $51,447 | $302,394 |
| 2016 | $5,064 | $346,905 | $50,439 | $296,466 |
| 2015 | $4,996 | $341,696 | $49,682 | $292,014 |
| 2014 | $4,900 | $335,004 | $48,709 | $286,295 |
Source: Public Records
Map
Nearby Homes
- 11017 Iron Creek Ave
- 11100 Eagle Rock Dr
- 11022 Eagle Rock Dr
- 11004 Chimney Rock Dr
- 10723 Iron Creek Ave
- 11009 Strathaven St
- 412 Hollyhill Dr Unit 8
- 10711 Four Bears Dr
- 10623 Fishers Peak Dr
- 10514 Brimhall Rd
- 10709 Whitburn St
- 11808 Wethersfield St
- 10931 Shellabarger Rd
- 11917 Leigh River St
- 10403 Bay Colony Dr
- 12008 Stonington St
- 204 Somerford Ct Unit 2
- 11510 Finsbury Ct
- 10418 Brimhall Rd
- 10220 Heather Valley Dr
- 11200 Iron Creek Ave
- 11106 Iron Creek Ave
- 11102 Iron Creek Ave
- 11204 Iron Creek Ave
- 11111 Iron Creek Ave
- 11201 Iron Creek Ave
- 11103 Iron Creek Ave
- 11016 Iron Creek Ave
- 11205 Iron Creek Ave
- 11108 Eagle Rock Dr
- 11012 Iron Creek Ave
- 11202 Eagle Rock Dr
- 11204 Eagle Rock Dr
- 11013 Iron Creek Ave
- 11008 Iron Creek Ave
- 11018 Eagle Rock Dr
- 11009 Iron Creek Ave
- 11004 Iron Creek Ave
- 11105 Eagle Rock Dr
- 11109 Eagle Rock Dr