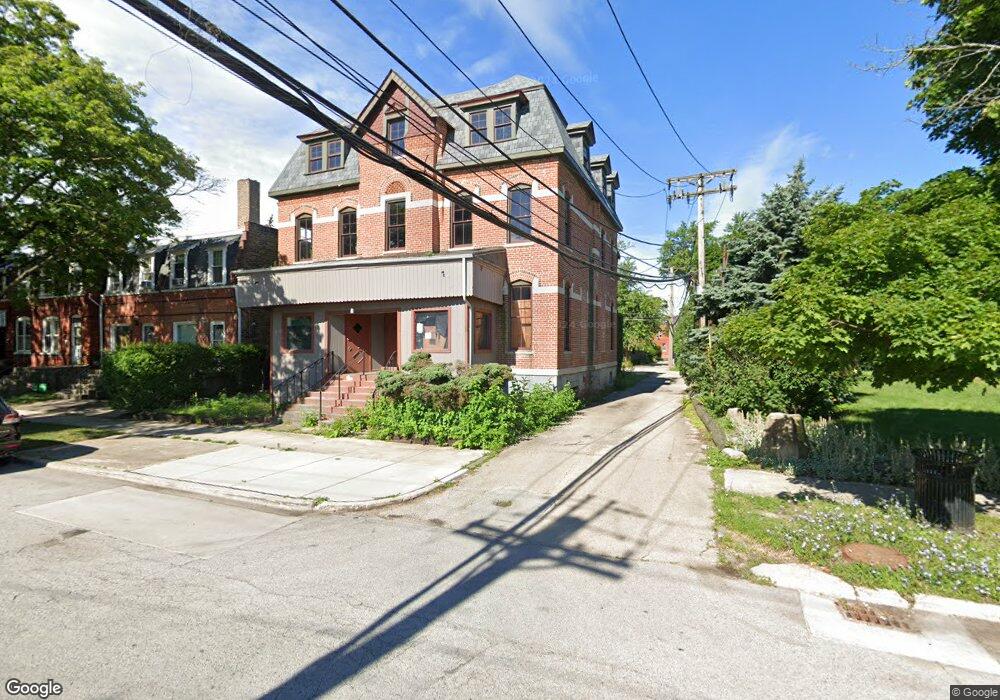
11112 S Langley Ave Chicago, IL 60628
Pullman NeighborhoodEstimated Value: $107,479 - $296,000
6
Beds
6
Baths
6,034
Sq Ft
$33/Sq Ft
Est. Value
About This Home
This home is located at 11112 S Langley Ave, Chicago, IL 60628 and is currently estimated at $201,740, approximately $33 per square foot. 11112 S Langley Ave is a home located in Cook County with nearby schools including Pullman Elementary School, Corliss High School, and CICS Prairie.
Ownership History
Date
Name
Owned For
Owner Type
Purchase Details
Closed on
Jul 23, 2014
Sold by
Certified Realty Partners Llc
Bought by
Langley Investment Group Llc
Current Estimated Value
Purchase Details
Closed on
Jun 19, 2014
Sold by
Bigerstaff Sharon K
Bought by
Certified Realty Partners Llc
Purchase Details
Closed on
Aug 21, 2007
Sold by
Pionke Earl J
Bought by
Biggerstaff Sharon K
Create a Home Valuation Report for This Property
The Home Valuation Report is an in-depth analysis detailing your home's value as well as a comparison with similar homes in the area
Home Values in the Area
Average Home Value in this Area
Purchase History
| Date | Buyer | Sale Price | Title Company |
|---|---|---|---|
| Langley Investment Group Llc | -- | None Available | |
| Certified Realty Partners Llc | $80,000 | Cti | |
| Biggerstaff Sharon K | $150,000 | None Available |
Source: Public Records
Tax History Compared to Growth
Tax History
| Year | Tax Paid | Tax Assessment Tax Assessment Total Assessment is a certain percentage of the fair market value that is determined by local assessors to be the total taxable value of land and additions on the property. | Land | Improvement |
|---|---|---|---|---|
| 2024 | $4,230 | $18,400 | $3,329 | $15,071 |
| 2023 | $4,126 | $20,000 | $7,212 | $12,788 |
| 2022 | $4,126 | $20,000 | $7,212 | $12,788 |
| 2021 | $4,033 | $19,999 | $7,212 | $12,787 |
| 2020 | $3,982 | $17,830 | $6,102 | $11,728 |
| 2019 | $4,082 | $20,262 | $6,102 | $14,160 |
| 2018 | $1,769 | $8,934 | $6,102 | $2,832 |
| 2017 | $1,984 | $9,194 | $5,548 | $3,646 |
| 2016 | $1,846 | $9,194 | $5,548 | $3,646 |
| 2015 | $4,368 | $23,778 | $5,548 | $18,230 |
| 2014 | $4,001 | $21,508 | $4,993 | $16,515 |
| 2013 | $3,921 | $21,508 | $4,993 | $16,515 |
Source: Public Records
Map
Nearby Homes
- 645 E 113th St
- 11317 S Champlain Ave
- 11333 S Langley Ave
- 447 E 111th Place
- 11133 S Vernon Ave
- 11349 S Saint Lawrence Ave Unit ROWHSE
- 22 E 112th St
- 11208 S Vernon Ave
- 11230 S Vernon Ave
- 11022 S Vernon Ave
- 10855 S Eberhart Ave
- 10947 S King Dr
- 10755 S Champlain Ave
- 10734 S Langley Ave
- 11418 S King Dr
- 10710 S Langley Ave
- 11423 S Calumet Ave
- 613 E 107th St
- 11437 S Calumet Ave
- 10718 S Rhodes Ave
- 11118 S Langley Ave
- 11116 S Langley Ave
- 11120 S Langley Ave
- 11122 S Langley Ave
- 11124 S Langley Ave
- 11126 S Langley Ave
- 11126 S Langley Ave Unit 1
- 645 E 111th St
- 11117 S Champlain Ave
- 11128 S Langley Ave
- 11119 S Champlain Ave
- 641 E 111th St
- 11123 S Champlain Ave
- 639 E 111th St
- 11130 S Langley Ave
- 11125 S Champlain Ave
- 11121 S Champlain Ave
- 11127 S Champlain Ave
- 11132 S Langley Ave
- 635 E 111th St