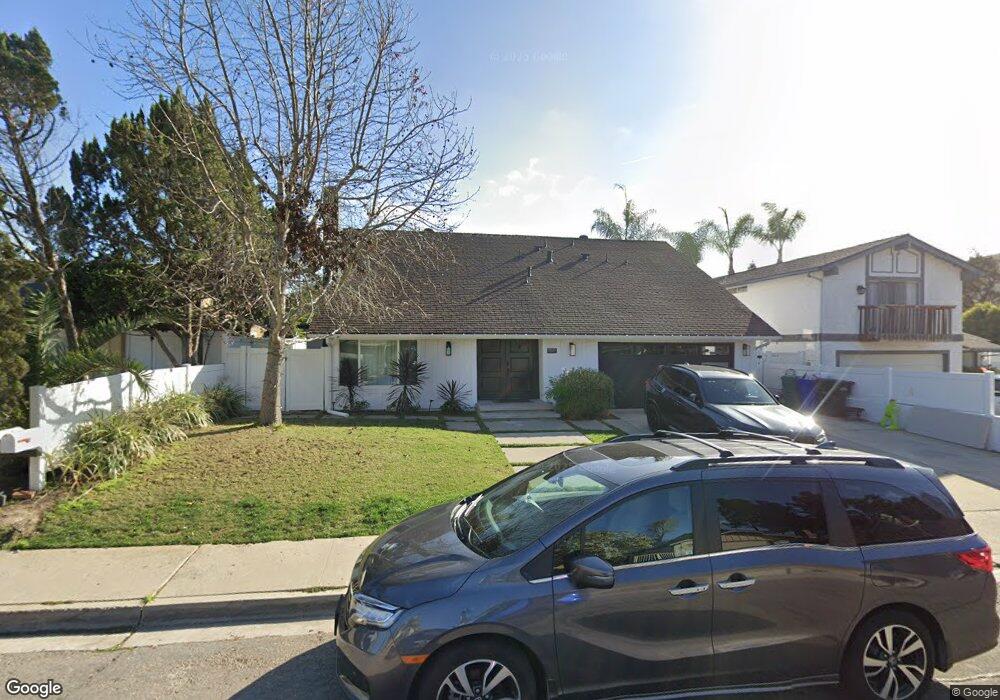
11113 Carlota St San Diego, CA 92129
Rancho Peñasquitos NeighborhoodEstimated Value: $1,246,323 - $1,525,000
4
Beds
3
Baths
2,110
Sq Ft
$661/Sq Ft
Est. Value
About This Home
This home is located at 11113 Carlota St, San Diego, CA 92129 and is currently estimated at $1,395,331, approximately $661 per square foot. 11113 Carlota St is a home located in San Diego County with nearby schools including Rolling Hills Elementary School, Black Mountain Middle School, and Mt. Carmel High School.
Ownership History
Date
Name
Owned For
Owner Type
Purchase Details
Closed on
Aug 3, 2020
Sold by
Vega Hugo and Vega Lindsay M
Bought by
H L Vega Family Trust
Current Estimated Value
Purchase Details
Closed on
Apr 2, 2020
Sold by
Taylor Michael V and Taylor Paula
Bought by
Taylor Lindsay N and Vega Hugo
Home Financials for this Owner
Home Financials are based on the most recent Mortgage that was taken out on this home.
Original Mortgage
$624,000
Interest Rate
3.37%
Mortgage Type
New Conventional
Purchase Details
Closed on
Dec 10, 2001
Sold by
Taylor Michael V
Bought by
Taylor Michael and Taylor Paula
Purchase Details
Closed on
Dec 3, 2001
Sold by
Taylor Paula
Bought by
Taylor Michael
Purchase Details
Closed on
Apr 19, 1991
Purchase Details
Closed on
Jul 13, 1988
Purchase Details
Closed on
Dec 2, 1983
Create a Home Valuation Report for This Property
The Home Valuation Report is an in-depth analysis detailing your home's value as well as a comparison with similar homes in the area
Home Values in the Area
Average Home Value in this Area
Purchase History
| Date | Buyer | Sale Price | Title Company |
|---|---|---|---|
| H L Vega Family Trust | -- | -- | |
| Taylor Lindsay N | $800,000 | Lawyers Title Company | |
| Taylor Michael | -- | First American Title | |
| Taylor Michael | -- | First American Title | |
| -- | $219,000 | -- | |
| -- | $169,800 | -- | |
| -- | $125,000 | -- |
Source: Public Records
Mortgage History
| Date | Status | Borrower | Loan Amount |
|---|---|---|---|
| Previous Owner | Taylor Lindsay N | $624,000 |
Source: Public Records
Tax History Compared to Growth
Tax History
| Year | Tax Paid | Tax Assessment Tax Assessment Total Assessment is a certain percentage of the fair market value that is determined by local assessors to be the total taxable value of land and additions on the property. | Land | Improvement |
|---|---|---|---|---|
| 2025 | $4,418 | $394,976 | $150,463 | $244,513 |
| 2024 | $4,418 | $387,232 | $147,513 | $239,719 |
| 2023 | $4,324 | $379,640 | $144,621 | $235,019 |
| 2022 | $4,250 | $372,197 | $141,786 | $230,411 |
| 2021 | $4,194 | $364,900 | $139,006 | $225,894 |
| 2020 | $4,058 | $361,159 | $137,581 | $223,578 |
| 2019 | $3,952 | $354,079 | $134,884 | $219,195 |
| 2018 | $3,839 | $347,138 | $132,240 | $214,898 |
| 2017 | $3,735 | $340,333 | $129,648 | $210,685 |
| 2016 | $3,656 | $333,660 | $127,106 | $206,554 |
| 2015 | $3,601 | $328,649 | $125,197 | $203,452 |
| 2014 | $3,515 | $322,212 | $122,745 | $199,467 |
Source: Public Records
Map
Nearby Homes
- 0 Madrigal St Unit 144
- 11183 Linares St
- 11225 Madrigal St
- 15020 Penasquitos Dr
- 11384 Almazon St
- 15541 Paseo Jenghiz
- 11378 Ajanta Ct
- 11385 Paseo Albacete
- 13124 Greer Dr
- 13144 Greer Dr
- 12980 Kelly Way
- 13146 Greer Dr
- 14793 Penasquitos Dr
- 13152 Greer Dr
- 15610 Corte Raposo
- 12662 Elizabeth Way
- 12566 Taylor Way
- 12555 Taylor Way
- Residence 2 Plan at Junipers - Sycamore
- Residence 3X Plan at Junipers - Lilac
- 11117 Carlota St
- 11097 Carlota St
- 11118 Raju St
- 11108 Raju St
- 11128 Raju St
- 11127 Carlota St
- 11138 Raju St
- 11114 Carlota St
- 11118 Carlota St
- 11108 Carlota St
- 11133 Carlota St
- 11104 Carlota St
- 11098 Carlota St
- 11088 Carlota St
- 11148 Raju St
- 11124 Carlota St
- 11078 Carlota St
- 11057 Carlota St
- 11128 Carlota St
- 11068 Carlota St