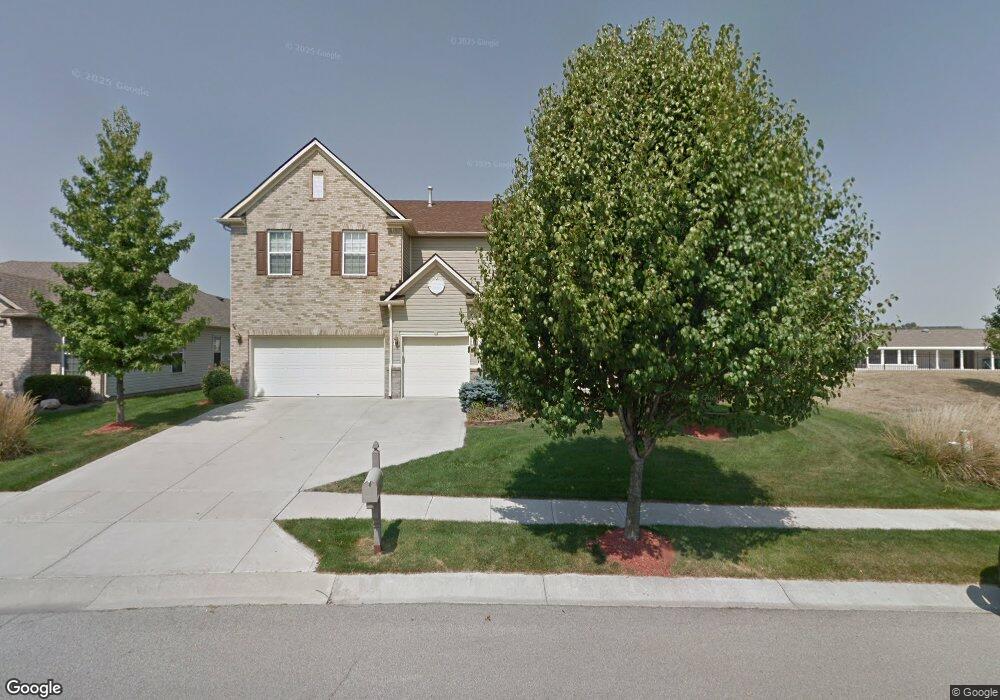
11116 Chandler Way Fishers, IN 46038
Estimated Value: $618,000 - $726,000
5
Beds
5
Baths
3,924
Sq Ft
$170/Sq Ft
Est. Value
About This Home
This home is located at 11116 Chandler Way, Fishers, IN 46038 and is currently estimated at $668,227, approximately $170 per square foot. 11116 Chandler Way is a home located in Hamilton County with nearby schools including Sand Creek Elementary School, Sand Creek Intermediate School, and Fishers Junior High School.
Ownership History
Date
Name
Owned For
Owner Type
Purchase Details
Closed on
Jun 29, 2016
Sold by
Graham John S and Graham Anita J
Bought by
Munoz Cuaughtemoc
Current Estimated Value
Home Financials for this Owner
Home Financials are based on the most recent Mortgage that was taken out on this home.
Original Mortgage
$295,920
Outstanding Balance
$236,841
Interest Rate
3.66%
Mortgage Type
New Conventional
Estimated Equity
$431,386
Purchase Details
Closed on
Jun 8, 2005
Sold by
Davis Homes Llc
Bought by
Graham John S and Graham Anita J
Home Financials for this Owner
Home Financials are based on the most recent Mortgage that was taken out on this home.
Original Mortgage
$296,327
Interest Rate
5.82%
Mortgage Type
Fannie Mae Freddie Mac
Purchase Details
Closed on
Jan 11, 2005
Sold by
Sedona Development Llc
Bought by
Davis Homes Llc
Create a Home Valuation Report for This Property
The Home Valuation Report is an in-depth analysis detailing your home's value as well as a comparison with similar homes in the area
Home Values in the Area
Average Home Value in this Area
Purchase History
| Date | Buyer | Sale Price | Title Company |
|---|---|---|---|
| Munoz Cuaughtemoc | -- | None Available | |
| Graham John S | -- | -- | |
| Davis Homes Llc | -- | -- |
Source: Public Records
Mortgage History
| Date | Status | Borrower | Loan Amount |
|---|---|---|---|
| Open | Munoz Cuaughtemoc | $295,920 | |
| Previous Owner | Graham John S | $296,327 |
Source: Public Records
Tax History Compared to Growth
Tax History
| Year | Tax Paid | Tax Assessment Tax Assessment Total Assessment is a certain percentage of the fair market value that is determined by local assessors to be the total taxable value of land and additions on the property. | Land | Improvement |
|---|---|---|---|---|
| 2024 | $6,154 | $535,500 | $69,100 | $466,400 |
| 2023 | $6,154 | $519,800 | $69,100 | $450,700 |
| 2022 | $5,819 | $476,200 | $69,100 | $407,100 |
| 2021 | $4,866 | $397,800 | $69,100 | $328,700 |
| 2020 | $4,491 | $360,700 | $70,500 | $290,200 |
| 2019 | $4,353 | $349,400 | $56,000 | $293,400 |
| 2018 | $4,284 | $337,200 | $56,000 | $281,200 |
| 2017 | $4,073 | $326,100 | $56,000 | $270,100 |
| 2016 | $3,682 | $292,300 | $56,000 | $236,300 |
| 2014 | $3,216 | $278,100 | $49,200 | $228,900 |
| 2013 | $3,216 | $265,500 | $49,200 | $216,300 |
Source: Public Records
Map
Nearby Homes
- 11069 Chandler Way
- 11090 Sanders Dr
- 13703 Van Buren Place
- 11581 Beardsley Way
- 13855 Boulder Canyon Dr
- 13281 Middlewood Ln
- 10414 Bicknell Cir
- 13763 Meadow Lake Dr
- 14279 Hidden Lakes Dr
- 11922 Charles Eric Way
- 14231 Coyote Ridge Dr
- The Pendula Plan at Marilyn Woods - The Signature Collection
- The Holbrook Plan at Marilyn Woods - The Courtyard Collection
- The Landram Plan at Marilyn Woods - The Classic Collection
- The Hoosier Plan at Marilyn Woods - The Signature Collection
- The Ditney Plan at Marilyn Woods - The Classic Collection
- 14247 Coyote Ridge Dr Unit 37598111
- The Crestline Plan at Marilyn Woods - The Signature Collection
- The Embassy Plan at Marilyn Woods - The Courtyard Collection
- Sandborn Plan at Marilyn Woods - The Signature Collection
- 11108 Chandler Way
- 11100 Chandler Way
- 13731 Gladden Ln
- 11117 Ellsworth Ln
- 11109 Ellsworth Ln
- 11101 Ellsworth Ln
- 13726 Gladden Ln
- 11093 Ellsworth Ln
- 11084 Chandler Way
- 13711 Gladden Ln
- 13712 Gladden Ln
- 11085 Ellsworth Ln
- 11140 Beardsley Way
- 11085 Chandler Way
- 11076 Chandler Way
- 11120 Ellsworth Ln
- 11112 Ellsworth Ln
- 11104 Ellsworth Ln
- 11096 Ellsworth Ln
- 13697 Gladden Ln