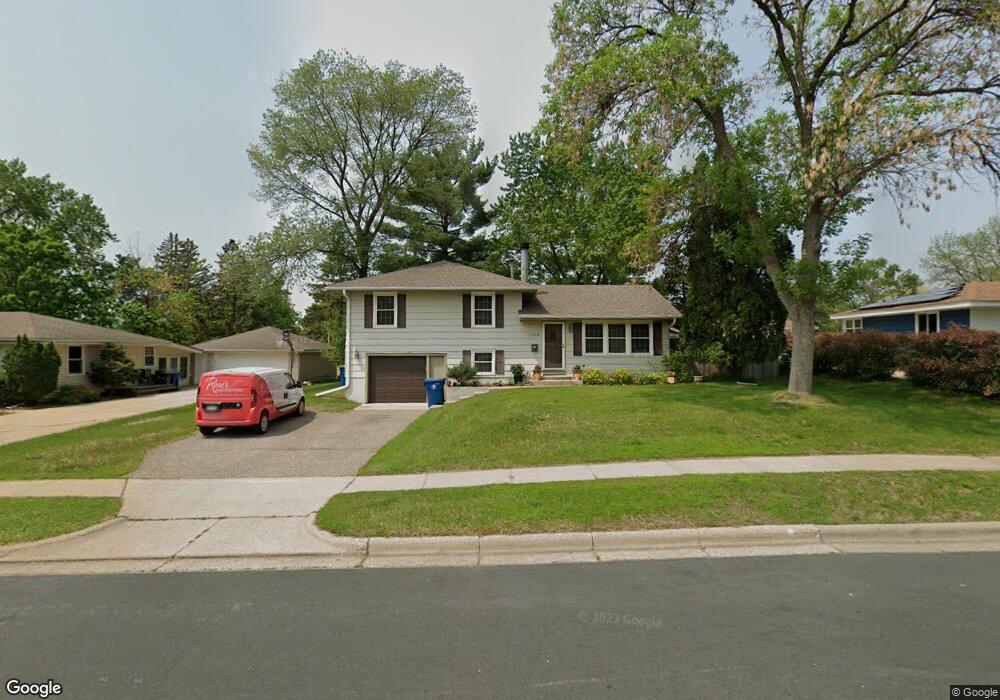
11116 Quinn Ave S Bloomington, MN 55437
West Bloomington NeighborhoodEstimated Value: $358,000 - $408,000
3
Beds
2
Baths
1,056
Sq Ft
$363/Sq Ft
Est. Value
About This Home
This home is located at 11116 Quinn Ave S, Bloomington, MN 55437 and is currently estimated at $383,646, approximately $363 per square foot. 11116 Quinn Ave S is a home located in Hennepin County with nearby schools including Westwood Elementary School, Oak Grove Middle School, and Jefferson Senior High School.
Ownership History
Date
Name
Owned For
Owner Type
Purchase Details
Closed on
Feb 2, 2016
Sold by
Mcgill Edmond A and Misener Thomas A
Bought by
Mcgill Edmond A and Misener Thomas A
Current Estimated Value
Home Financials for this Owner
Home Financials are based on the most recent Mortgage that was taken out on this home.
Original Mortgage
$162,000
Outstanding Balance
$69,925
Interest Rate
4%
Mortgage Type
New Conventional
Estimated Equity
$313,721
Purchase Details
Closed on
Feb 23, 2004
Sold by
Burlowski John E
Bought by
Mcgill Edmond A
Create a Home Valuation Report for This Property
The Home Valuation Report is an in-depth analysis detailing your home's value as well as a comparison with similar homes in the area
Home Values in the Area
Average Home Value in this Area
Purchase History
| Date | Buyer | Sale Price | Title Company |
|---|---|---|---|
| Mcgill Edmond A | -- | All American Title Co Inc | |
| Mcgill Edmond A | $222,000 | -- |
Source: Public Records
Mortgage History
| Date | Status | Borrower | Loan Amount |
|---|---|---|---|
| Open | Mcgill Edmond A | $162,000 |
Source: Public Records
Tax History Compared to Growth
Tax History
| Year | Tax Paid | Tax Assessment Tax Assessment Total Assessment is a certain percentage of the fair market value that is determined by local assessors to be the total taxable value of land and additions on the property. | Land | Improvement |
|---|---|---|---|---|
| 2024 | $4,094 | $330,300 | $149,400 | $180,900 |
| 2023 | $4,053 | $342,300 | $161,200 | $181,100 |
| 2022 | $3,409 | $336,300 | $158,200 | $178,100 |
| 2021 | $3,108 | $276,800 | $134,000 | $142,800 |
| 2020 | $3,272 | $257,100 | $130,200 | $126,900 |
| 2019 | $2,850 | $262,400 | $130,200 | $132,200 |
| 2018 | $2,740 | $228,600 | $126,700 | $101,900 |
| 2017 | $2,521 | $202,100 | $113,800 | $88,300 |
| 2016 | $2,630 | $200,200 | $113,200 | $87,000 |
| 2015 | $2,547 | $188,200 | $109,800 | $78,400 |
| 2014 | -- | $172,700 | $106,400 | $66,300 |
Source: Public Records
Map
Nearby Homes
- 4725 W 110th St
- 10916 Oxborough Ave S
- 4600 Morris Ln
- 11115 Vessey Cir
- 11024 Little Ave S
- 11250 Vessey Ave S
- 5100 Balmoral Ln
- 11252 Vessey Ave S
- 4816 Overlook Dr
- 11509 Palmer Rd
- 10726 Toledo Ct
- 11416 Kell Rd
- 5275 Balmoral Ln
- 11313 Xavier Rd
- 11341 Kell Rd
- 5410 W Old Shakopee Cir
- 5392 W Old Shakopee Cir
- 11649 Palmer Rd
- 10616 Johnson Rd
- 10600 Normandale Blvd
- 11108 Quinn Ave S
- 11124 Quinn Ave S
- 11100 Quinn Ave S
- 11023 Stanley Curve
- 11132 Quinn Ave S
- 11021 Stanley Curve
- 11025 Stanley Curve
- 11101 Quinn Ave S
- 11024 Quinn Ave S
- 11019 Stanley Curve
- 11117 Quinn Ave S
- 11140 Quinn Ave S
- 11125 Quinn Ave S
- 11016 Quinn Ave S
- 4917 W 111th St
- 11148 Quinn Ave S
- 11027 Stanley Curve
- 11017 Stanley Curve
- 11025 Quinn Ave S
- 5200 W 111th St