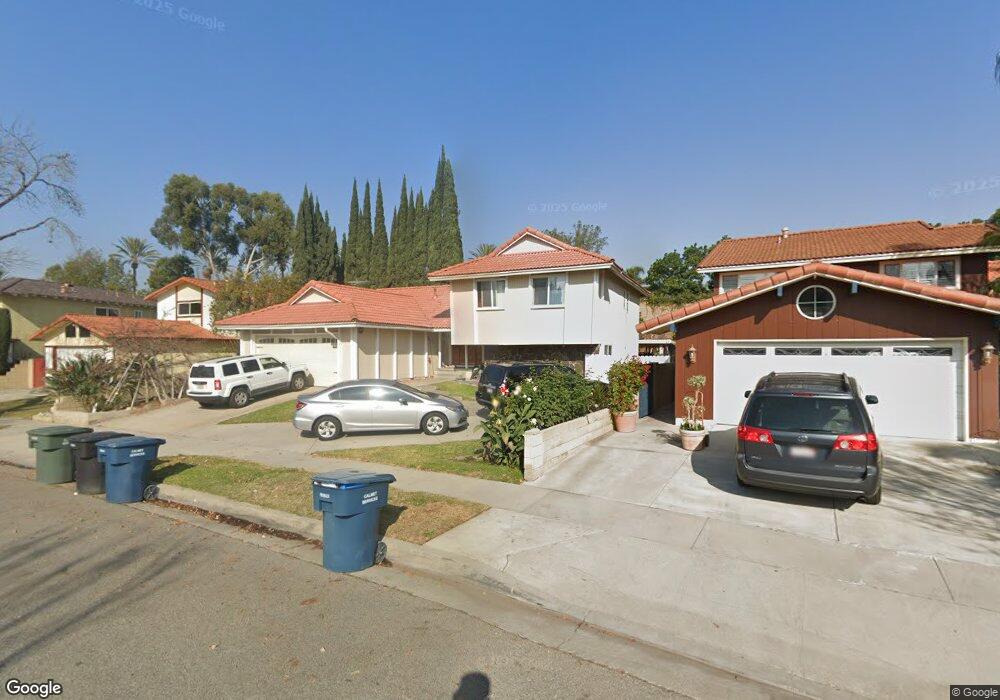
11119 Hibbing St Cerritos, CA 90703
Estimated Value: $1,245,000 - $1,312,000
4
Beds
3
Baths
2,284
Sq Ft
$557/Sq Ft
Est. Value
About This Home
This home is located at 11119 Hibbing St, Cerritos, CA 90703 and is currently estimated at $1,271,905, approximately $556 per square foot. 11119 Hibbing St is a home located in Los Angeles County with nearby schools including Bragg Elementary School, Haskell Stem Academy, and Gahr High School.
Ownership History
Date
Name
Owned For
Owner Type
Purchase Details
Closed on
May 18, 2006
Sold by
Creus Romualdo L and Creus Elvira M
Bought by
Creus Blanca M and Creus Luzviminda M
Current Estimated Value
Purchase Details
Closed on
May 30, 2001
Sold by
Munoz Thomas and Munoz Justina I
Bought by
Creus Romualdo and Creus Elvira M
Home Financials for this Owner
Home Financials are based on the most recent Mortgage that was taken out on this home.
Original Mortgage
$220,000
Interest Rate
7.14%
Purchase Details
Closed on
Nov 17, 1999
Sold by
Mike Garcia Trust and Michell Marie
Bought by
Munoz Thomas and Munoz Justina I
Home Financials for this Owner
Home Financials are based on the most recent Mortgage that was taken out on this home.
Original Mortgage
$281,000
Interest Rate
9.2%
Purchase Details
Closed on
Jan 17, 1994
Sold by
Garcia Mike
Bought by
Garcia Mike
Create a Home Valuation Report for This Property
The Home Valuation Report is an in-depth analysis detailing your home's value as well as a comparison with similar homes in the area
Home Values in the Area
Average Home Value in this Area
Purchase History
| Date | Buyer | Sale Price | Title Company |
|---|---|---|---|
| Creus Blanca M | -- | None Available | |
| Creus Romualdo | $345,000 | Fidelity Title | |
| Munoz Thomas | -- | Commonwealth Title | |
| Garcia Mike | -- | -- |
Source: Public Records
Mortgage History
| Date | Status | Borrower | Loan Amount |
|---|---|---|---|
| Previous Owner | Creus Romualdo | $220,000 | |
| Previous Owner | Munoz Thomas | $281,000 |
Source: Public Records
Tax History Compared to Growth
Tax History
| Year | Tax Paid | Tax Assessment Tax Assessment Total Assessment is a certain percentage of the fair market value that is determined by local assessors to be the total taxable value of land and additions on the property. | Land | Improvement |
|---|---|---|---|---|
| 2025 | $6,214 | $509,644 | $316,575 | $193,069 |
| 2024 | $6,214 | $499,652 | $310,368 | $189,284 |
| 2023 | $6,015 | $489,856 | $304,283 | $185,573 |
| 2022 | $5,923 | $480,252 | $298,317 | $181,935 |
| 2021 | $5,778 | $470,836 | $292,468 | $178,368 |
| 2019 | $5,645 | $456,874 | $283,795 | $173,079 |
| 2018 | $5,189 | $447,917 | $278,231 | $169,686 |
| 2016 | $4,969 | $430,526 | $267,428 | $163,098 |
| 2015 | $4,906 | $424,060 | $263,411 | $160,649 |
| 2014 | $4,810 | $415,755 | $258,252 | $157,503 |
Source: Public Records
Map
Nearby Homes
- 19127 Allingham Ave
- 18548 San Gabriel Ave
- 18747 West Place
- 6705 Denmead St
- 11540 187th St
- 6745 Yearling St
- 10732 Andy St
- 11620 187th St
- 19731 Sally Ave
- 6322 Cardale St
- 19127 Pioneer Blvd Unit 30
- 19127 Pioneer Blvd Unit 9
- 19127 Pioneer Blvd Unit SPC 23
- 19127 Pioneer Blvd Unit 27
- 18316 Santana Ave
- 17912 Gridley Rd
- 11328 Felson St
- 20425 Harvest Ave
- 11702 Christy St
- 11425 178th St
- 11113 Hibbing St
- 11125 Hibbing St
- 11107 Hibbing St
- 19102 Crossdale Ave
- 11120 Hibbing St
- 11110 Hibbing St
- 11103 Hibbing St
- 19108 Crossdale Ave
- 19105 Crossdale Ave
- 11104 Hibbing St
- 11037 Hibbing St
- 11038 Hibbing St
- 19115 Crossdale Ave
- 19114 Crossdale Ave
- 11063 Bigelow Cir
- 11057 Bigelow Cir
- 11031 Hibbing St
- 19102 Benfield Ave
- 11032 Hibbing St
- 19121 Crossdale Ave