Estimated Value: $515,000 - $566,000
--
Bed
3
Baths
3,012
Sq Ft
$179/Sq Ft
Est. Value
About This Home
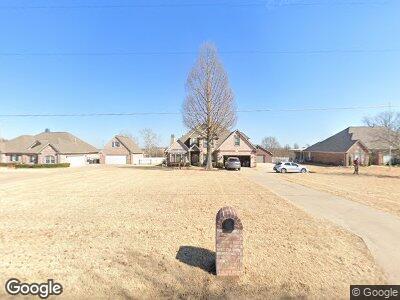
This home is located at 11119 S Juniper St, Jenks, OK 74037 and is currently estimated at $537,950, approximately $178 per square foot. 11119 S Juniper St is a home located in Tulsa County with nearby schools including Jenks West Elementary School, Jenks West Intermediate Elementary School, and Jenks Middle School.
Ownership History
Date
Name
Owned For
Owner Type
Purchase Details
Closed on
Feb 27, 1998
Sold by
Craftmaster Custom Builders
Bought by
Bowling Daniel P and Bowling Dorothy M
Current Estimated Value
Home Financials for this Owner
Home Financials are based on the most recent Mortgage that was taken out on this home.
Original Mortgage
$126,650
Interest Rate
6.91%
Mortgage Type
Purchase Money Mortgage
Purchase Details
Closed on
Oct 28, 1997
Sold by
Bowling Daniel P and Bowling Dorothy M
Bought by
Mike Fretz Inc
Home Financials for this Owner
Home Financials are based on the most recent Mortgage that was taken out on this home.
Original Mortgage
$136,202
Interest Rate
7.33%
Mortgage Type
Construction
Purchase Details
Closed on
Aug 15, 1997
Sold by
Konschak Helen Marie and Konschak Theodore
Bought by
Grimes Francis M
Create a Home Valuation Report for This Property
The Home Valuation Report is an in-depth analysis detailing your home's value as well as a comparison with similar homes in the area
Home Values in the Area
Average Home Value in this Area
Purchase History
| Date | Buyer | Sale Price | Title Company |
|---|---|---|---|
| Bowling Daniel P | $169,000 | Frisco Title Corp | |
| Craftmaster Custom Builders | -- | Frisco Title Corp | |
| Mike Fretz Inc | $32,000 | Meridian Title & Closing Inc | |
| Grimes Francis M | -- | Frisco Title Corp |
Source: Public Records
Mortgage History
| Date | Status | Borrower | Loan Amount |
|---|---|---|---|
| Open | Bowling Daniel P | $70,000 | |
| Closed | Bowling Daniel P | $30,000 | |
| Open | Bowling Daniel P | $208,000 | |
| Closed | Bowling Daniel P | $17,000 | |
| Closed | Bowling Daniel P | $196,000 | |
| Closed | Bowling Daniel P | $126,650 | |
| Previous Owner | Mike Fretz Inc | $136,202 | |
| Closed | Bowling Daniel P | $25,250 |
Source: Public Records
Tax History Compared to Growth
Tax History
| Year | Tax Paid | Tax Assessment Tax Assessment Total Assessment is a certain percentage of the fair market value that is determined by local assessors to be the total taxable value of land and additions on the property. | Land | Improvement |
|---|---|---|---|---|
| 2024 | $3,115 | $24,467 | $2,024 | $22,443 |
| 2023 | $3,115 | $26,467 | $2,416 | $24,051 |
| 2022 | $3,145 | $24,467 | $3,666 | $20,801 |
| 2021 | $3,216 | $24,696 | $3,700 | $20,996 |
| 2020 | $3,145 | $24,696 | $3,700 | $20,996 |
| 2019 | $3,167 | $24,696 | $3,700 | $20,996 |
| 2018 | $2,847 | $22,056 | $3,683 | $18,373 |
| 2017 | $2,800 | $23,056 | $3,850 | $19,206 |
| 2016 | $2,869 | $23,056 | $3,850 | $19,206 |
| 2015 | $2,924 | $23,056 | $3,850 | $19,206 |
| 2014 | $2,990 | $23,056 | $3,850 | $19,206 |
Source: Public Records
Map
Nearby Homes
- 11224 S Fir Ave
- 11264 S Fir Ave
- 11312 S Fir Ave
- 11308 S Fir Ave
- 11261 S Fir Ave
- 11265 S Fir Ave
- 11257 S Fir Ave
- 11249 S Fir Ave
- 698 W 113th Ct S
- 1226 W 109th Place S
- 682 W 113th Ct S
- 11395 S Juniper St
- 11229 S Nandina Ave
- 1414 W 114th St S
- 10709 S Holley St
- 716 W 108th Place S
- 11521 S Locust Ave
- 10708 S Gum St
- 11413 S Nandina Place
- 11407 S Oak Ct
- 11119 S Juniper St
- 11105 S Juniper St
- 11127 S Juniper St
- 11209 S Juniper St
- 11102 S Juniper St
- 0 S Juniper St Unit 1915585
- 11202 S Elgin Ave
- 11118 S Juniper St
- 11201 S Juniper St
- 11126 S Juniper St
- 1120 W 111th St S
- 11099 S Juniper St
- 11186 S Juniper St
- 1168 W 111th St S
- 11098 S Juniper St
- 11237 S Juniper St
- 740 W 110th Place S
- 1201 W 112th Dr S
- 1206 W 112th Dr S
- 11015 S Juniper St