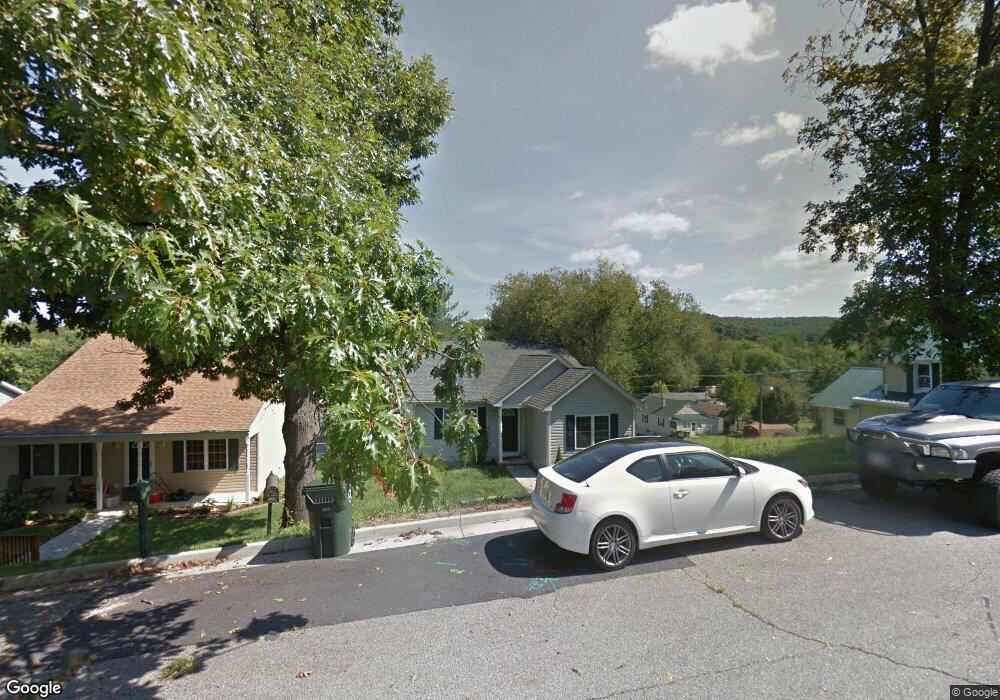
1112 3rd St Waynesboro, VA 22980
Estimated Value: $255,000 - $276,000
3
Beds
2
Baths
1,346
Sq Ft
$200/Sq Ft
Est. Value
About This Home
This home is located at 1112 3rd St, Waynesboro, VA 22980 and is currently estimated at $269,431, approximately $200 per square foot. 1112 3rd St is a home located in Waynesboro City with nearby schools including Wenonah Elementary School, Kate Collins Middle School, and Waynesboro High School.
Ownership History
Date
Name
Owned For
Owner Type
Purchase Details
Closed on
Dec 12, 2011
Sold by
Va Housing Develop Authority
Bought by
Miller Christopher D
Current Estimated Value
Home Financials for this Owner
Home Financials are based on the most recent Mortgage that was taken out on this home.
Original Mortgage
$110,000
Outstanding Balance
$75,536
Interest Rate
4.09%
Mortgage Type
VA
Estimated Equity
$193,895
Purchase Details
Closed on
Aug 9, 2011
Sold by
Butler April M
Bought by
Va Housing Dev Authority
Purchase Details
Closed on
Dec 17, 2008
Sold by
Acend 2002 Llc
Bought by
Butler April M
Home Financials for this Owner
Home Financials are based on the most recent Mortgage that was taken out on this home.
Original Mortgage
$158,610
Interest Rate
5.88%
Mortgage Type
New Conventional
Create a Home Valuation Report for This Property
The Home Valuation Report is an in-depth analysis detailing your home's value as well as a comparison with similar homes in the area
Home Values in the Area
Average Home Value in this Area
Purchase History
| Date | Buyer | Sale Price | Title Company |
|---|---|---|---|
| Miller Christopher D | $110,000 | -- | |
| Va Housing Dev Authority | $100,003 | -- | |
| Butler April M | $155,500 | -- |
Source: Public Records
Mortgage History
| Date | Status | Borrower | Loan Amount |
|---|---|---|---|
| Open | Butler April M | $110,000 | |
| Previous Owner | Butler April M | $158,610 |
Source: Public Records
Tax History Compared to Growth
Tax History
| Year | Tax Paid | Tax Assessment Tax Assessment Total Assessment is a certain percentage of the fair market value that is determined by local assessors to be the total taxable value of land and additions on the property. | Land | Improvement |
|---|---|---|---|---|
| 2025 | $2,056 | $250,700 | $33,500 | $217,200 |
| 2024 | $1,659 | $215,400 | $28,500 | $186,900 |
| 2023 | $1,659 | $215,400 | $28,500 | $186,900 |
| 2022 | $1,504 | $167,100 | $25,000 | $142,100 |
| 2021 | $1,504 | $167,100 | $25,000 | $142,100 |
| 2020 | $1,317 | $146,300 | $25,000 | $121,300 |
| 2019 | $1,317 | $146,300 | $25,000 | $121,300 |
| 2018 | $1,099 | $122,100 | $25,000 | $97,100 |
| 2017 | $1,062 | $122,100 | $25,000 | $97,100 |
| 2016 | $944 | $118,000 | $25,000 | $93,000 |
| 2015 | $944 | $118,000 | $25,000 | $93,000 |
| 2014 | -- | $121,100 | $25,000 | $96,100 |
| 2013 | -- | $0 | $0 | $0 |
Source: Public Records
Map
Nearby Homes
- 1207 4th St
- 1032 D St
- 1428 2nd St
- 317 Ivanhoe Ave
- 313 Ivanhoe Ave
- 309 Ivanhoe Ave
- 1200 5th St
- 0 5th St
- 1200 5th St Unit 1200, 1204, 1208
- 425 S Jackson Ave
- 600 N Bayard Ave
- 609 N Bayard Ave
- 601 N Bayard Ave
- 821 N Bayard Ave
- 720 Shenandoah Ave
- 756 N Augusta Ave
- 1019 Frye St
- 1015 Frye St
- 1025 Frye St
- 1715 3rd St