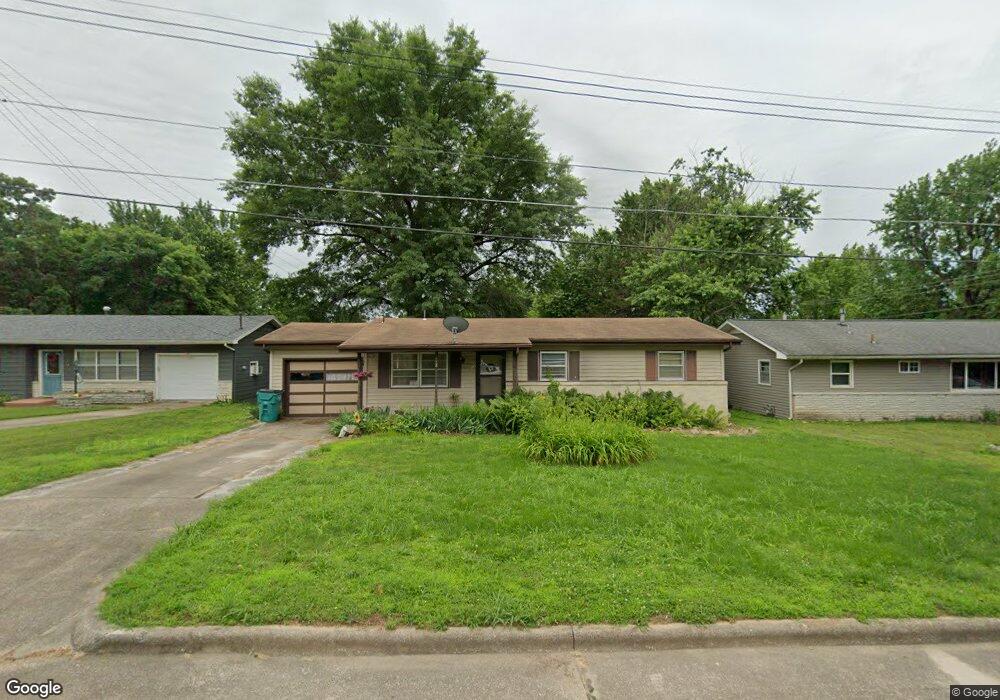
1112 E McClernon St Springfield, MO 65803
Estimated Value: $156,101 - $170,000
3
Beds
1
Bath
1,040
Sq Ft
$156/Sq Ft
Est. Value
About This Home
This home is located at 1112 E McClernon St, Springfield, MO 65803 and is currently estimated at $161,775, approximately $155 per square foot. 1112 E McClernon St is a home located in Greene County with nearby schools including Watkins Elementary School, Reed Academy, and Hillcrest High School.
Ownership History
Date
Name
Owned For
Owner Type
Purchase Details
Closed on
Aug 12, 2025
Sold by
Hancock Bladen and Hancock Emme
Bought by
Hancock Bladen and Hancock Emme
Current Estimated Value
Home Financials for this Owner
Home Financials are based on the most recent Mortgage that was taken out on this home.
Original Mortgage
$105,000
Outstanding Balance
$104,908
Interest Rate
6.67%
Mortgage Type
New Conventional
Estimated Equity
$56,867
Purchase Details
Closed on
Sep 19, 2024
Sold by
Joint Revocable Trust Agreement Of Garry and Bays Garry D
Bought by
Hancock Bladen
Home Financials for this Owner
Home Financials are based on the most recent Mortgage that was taken out on this home.
Original Mortgage
$117,500
Interest Rate
6.47%
Mortgage Type
New Conventional
Purchase Details
Closed on
Jan 11, 2012
Sold by
Bays Bonnie May
Bought by
Bays Garry D and Bays Bonnie
Create a Home Valuation Report for This Property
The Home Valuation Report is an in-depth analysis detailing your home's value as well as a comparison with similar homes in the area
Purchase History
| Date | Buyer | Sale Price | Title Company |
|---|---|---|---|
| Hancock Bladen | -- | None Listed On Document | |
| Hancock Bladen | -- | None Listed On Document | |
| Bays Garry D | -- | None Available |
Source: Public Records
Mortgage History
| Date | Status | Borrower | Loan Amount |
|---|---|---|---|
| Open | Hancock Bladen | $105,000 | |
| Previous Owner | Hancock Bladen | $117,500 |
Source: Public Records
Tax History
| Year | Tax Paid | Tax Assessment Tax Assessment Total Assessment is a certain percentage of the fair market value that is determined by local assessors to be the total taxable value of land and additions on the property. | Land | Improvement |
|---|---|---|---|---|
| 2025 | $842 | $16,910 | $5,700 | $11,210 |
| 2024 | $790 | $14,730 | $3,800 | $10,930 |
| 2023 | $786 | $14,730 | $3,800 | $10,930 |
| 2022 | $753 | $13,790 | $3,800 | $9,990 |
| 2021 | $753 | $13,790 | $3,800 | $9,990 |
| 2020 | $702 | $12,290 | $3,800 | $8,490 |
| 2019 | $682 | $12,290 | $3,800 | $8,490 |
| 2018 | $645 | $11,630 | $3,230 | $8,400 |
| 2017 | $639 | $11,630 | $3,230 | $8,400 |
| 2016 | $637 | $11,630 | $3,230 | $8,400 |
| 2015 | $632 | $11,630 | $3,230 | $8,400 |
| 2014 | $636 | $11,630 | $3,230 | $8,400 |
Source: Public Records
Map
Nearby Homes
- 1107 E Smith St
- 1113 E Smith St
- 1103 E Smith St
- 1017 E McClernon St
- 1005 E McClernon St
- 1039 E Caravan St
- 1339 E McClernon St
- 801 E Hill St
- 1414 E Smith St
- 1255 E Bonaire Dr
- 917 E Kerr St
- 1502 E McClernon St
- 2723 N National Ave
- 2801 N Summit Ave
- 2823 N Washington Ave
- 1406 E Nora St
- 2632 N Kellett Ave
- 2632 N Prospect Ave
- 1012 E Talmage St
- 404 E Evergreen St
- 1104 E McClernon St
- 1118 E McClernon St
- 1124 E McClernon St
- 1107 E McClernon St
- 1126 E McClernon St
- 1117 E McClernon St
- 3125 N Howard Ave
- 1123 E McCanse St
- 1109 E McCanse St
- 3119 N Howard Ave
- 1115 E McCanse St
- 3135 N Howard Ave
- 3102 N Howard Ave
- 1125 E McClernon St
- 3145 N Howard Ave
- 3105 N Howard Ave
- 1135 E McCanse St
- 1046 E McClernon St
- 1112 E Smith St
- 1106 E Smith St
Your Personal Tour Guide
Ask me questions while you tour the home.