1112 Ellis Ct Chapmansboro, TN 37035
Estimated Value: $297,000 - $340,000
--
Bed
2
Baths
1,382
Sq Ft
$232/Sq Ft
Est. Value
About This Home
This home is located at 1112 Ellis Ct, Chapmansboro, TN 37035 and is currently estimated at $320,957, approximately $232 per square foot. 1112 Ellis Ct is a home located in Cheatham County with nearby schools including Pleasant View Elementary School, Sycamore Middle School, and Sycamore High School.
Ownership History
Date
Name
Owned For
Owner Type
Purchase Details
Closed on
Jan 31, 2025
Sold by
Russell Family Trust and Russell Joseph F
Bought by
Mikhail Mariam and Brown Brandon T
Current Estimated Value
Home Financials for this Owner
Home Financials are based on the most recent Mortgage that was taken out on this home.
Original Mortgage
$304,385
Outstanding Balance
$302,508
Interest Rate
6.72%
Mortgage Type
FHA
Estimated Equity
$18,449
Purchase Details
Closed on
Jun 21, 2017
Sold by
Russell Joseph F and Russell Freda G
Bought by
Russell Jospeh F and Russell Freda G
Purchase Details
Closed on
Jul 29, 2009
Sold by
Ann Griffin Ruth
Bought by
Russell Joseph F
Purchase Details
Closed on
Dec 27, 1988
Bought by
Frye Anthony Bernaed and Helen Joyce
Purchase Details
Closed on
Jun 30, 1988
Bought by
Wemyss William
Purchase Details
Closed on
Dec 29, 1977
Bought by
Chambliss Carl
Create a Home Valuation Report for This Property
The Home Valuation Report is an in-depth analysis detailing your home's value as well as a comparison with similar homes in the area
Home Values in the Area
Average Home Value in this Area
Purchase History
| Date | Buyer | Sale Price | Title Company |
|---|---|---|---|
| Mikhail Mariam | $310,000 | Homestead Title | |
| Mikhail Mariam | $310,000 | Homestead Title | |
| Russell Jospeh F | -- | None Available | |
| Russell Joseph F | $58,000 | -- | |
| Frye Anthony Bernaed | -- | -- | |
| Wemyss William | -- | -- | |
| -- | $5,500 | -- | |
| Chambliss Carl | -- | -- |
Source: Public Records
Mortgage History
| Date | Status | Borrower | Loan Amount |
|---|---|---|---|
| Open | Mikhail Mariam | $304,385 | |
| Closed | Mikhail Mariam | $304,385 |
Source: Public Records
Tax History Compared to Growth
Tax History
| Year | Tax Paid | Tax Assessment Tax Assessment Total Assessment is a certain percentage of the fair market value that is determined by local assessors to be the total taxable value of land and additions on the property. | Land | Improvement |
|---|---|---|---|---|
| 2024 | $1,133 | $65,475 | $13,850 | $51,625 |
| 2023 | $1,043 | $36,625 | $3,400 | $33,225 |
| 2022 | $986 | $36,625 | $3,400 | $33,225 |
| 2021 | $1,160 | $36,625 | $3,400 | $33,225 |
| 2020 | $1,160 | $43,100 | $3,400 | $39,700 |
| 2019 | $1,160 | $43,100 | $3,400 | $39,700 |
| 2018 | $1,041 | $33,175 | $2,475 | $30,700 |
| 2017 | $985 | $33,175 | $2,475 | $30,700 |
| 2016 | $937 | $33,175 | $2,475 | $30,700 |
| 2015 | $841 | $27,850 | $2,475 | $25,375 |
| 2014 | $841 | $27,850 | $2,475 | $25,375 |
Source: Public Records
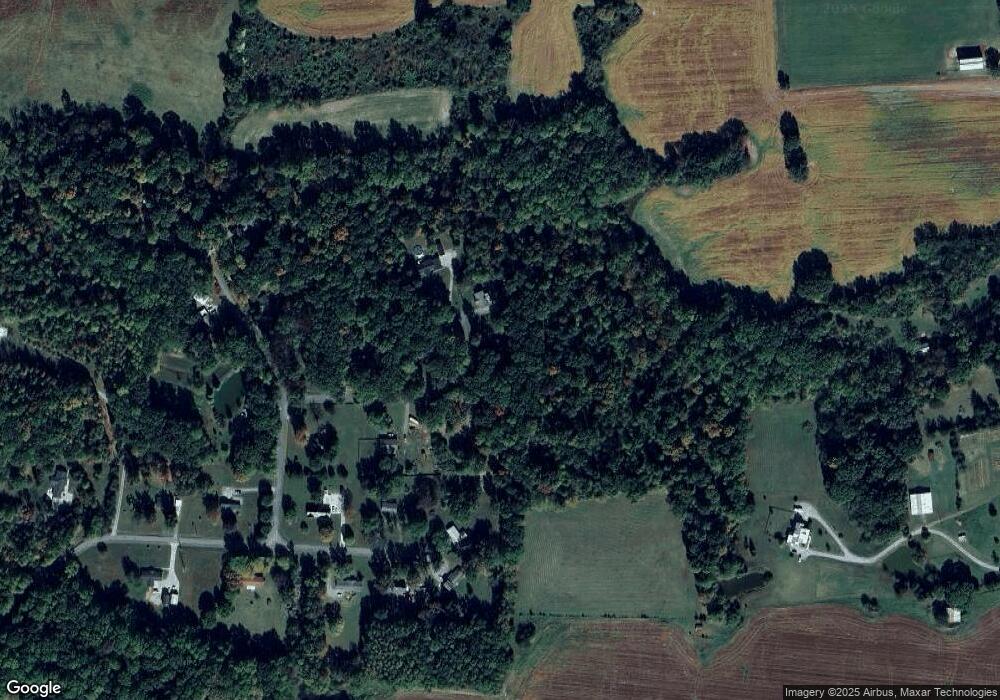
Map
Nearby Homes
- 1136 Dimple Rd
- 2220 Pleasant View Rd
- 0 Keystone Dr
- Crocker III H Plan at Highland Reserves - The Estates
- Adams IV G Plan at Highland Reserves - The Estates
- Hudson Plan at Highland Reserves
- Harding Plan at Highland Reserves
- Calderwood Plan at Highland Reserves
- Camphor III H Plan at Highland Reserves - The Estates
- Charlotte III H Plan at Highland Reserves - The Estates
- Charlotte III G Plan at Highland Reserves - The Estates
- Camphor III G Plan at Highland Reserves - The Estates
- Sinclair Plan at Highland Reserves
- Adams IV H Plan at Highland Reserves - The Estates
- Jacob IV H Plan at Highland Reserves - The Estates
- Crocker III G Plan at Highland Reserves - The Estates
- Jacob IV G Plan at Highland Reserves - The Estates
- Augusta B Plan at The Greens at Legacy Townhomes
- Pinehurst II A Plan at The Greens at Legacy Townhomes
- Augusta A Plan at The Greens at Legacy Townhomes
- 1116 Ellis Ct
- 1108 Ellis Ct
- 1109 Ellis Ct
- 1119 Ellis Ct
- 1105 Ellis Ct
- 1106 Ellis Ct
- 830 Balthrop Rd
- 763 Balthrop Rd
- 769 Balthrop Rd
- 810 Balthrop Rd
- 832 Balthrop Rd
- 768 Balthrop Rd
- 759 Balthrop Rd
- 764 Balthrop Rd
- 809 Balthrop Rd
- 838 Balthrop Rd
- 762 Balthrop Rd
- 833 Balthrop Rd
- 755 Balthrop Rd
- 758 Balthrop Rd