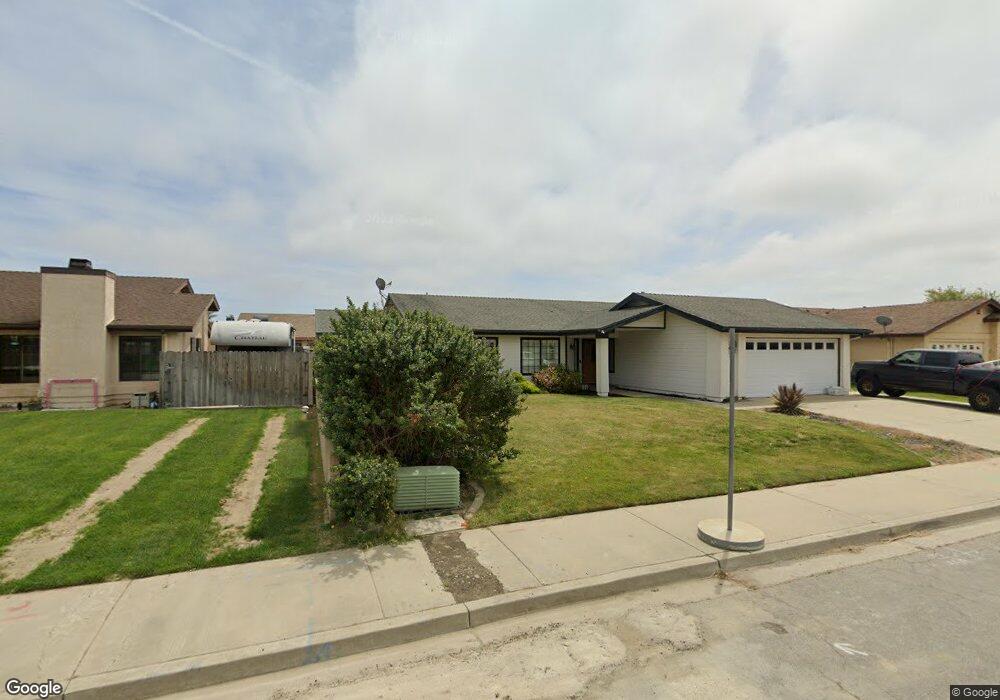
1112 N Y St Lompoc, CA 93436
West Lompoc NeighborhoodEstimated Value: $534,705 - $623,000
3
Beds
2
Baths
1,496
Sq Ft
$388/Sq Ft
Est. Value
About This Home
This home is located at 1112 N Y St, Lompoc, CA 93436 and is currently estimated at $580,176, approximately $387 per square foot. 1112 N Y St is a home located in Santa Barbara County with nearby schools including Clarence Ruth Elementary School, Lompoc Valley Middle School, and Lompoc High School.
Ownership History
Date
Name
Owned For
Owner Type
Purchase Details
Closed on
May 9, 2016
Sold by
Smith Scott W
Bought by
Smith Scott W and Smith Heather D
Current Estimated Value
Home Financials for this Owner
Home Financials are based on the most recent Mortgage that was taken out on this home.
Original Mortgage
$273,300
Outstanding Balance
$214,613
Interest Rate
3.25%
Mortgage Type
FHA
Estimated Equity
$365,563
Purchase Details
Closed on
Mar 7, 2011
Sold by
Smith Heather D
Bought by
Smith Scott W
Home Financials for this Owner
Home Financials are based on the most recent Mortgage that was taken out on this home.
Original Mortgage
$252,434
Interest Rate
4.75%
Mortgage Type
FHA
Purchase Details
Closed on
Feb 23, 2011
Sold by
Fleming Michael R
Bought by
Smith Scott W
Home Financials for this Owner
Home Financials are based on the most recent Mortgage that was taken out on this home.
Original Mortgage
$252,434
Interest Rate
4.75%
Mortgage Type
FHA
Create a Home Valuation Report for This Property
The Home Valuation Report is an in-depth analysis detailing your home's value as well as a comparison with similar homes in the area
Home Values in the Area
Average Home Value in this Area
Purchase History
| Date | Buyer | Sale Price | Title Company |
|---|---|---|---|
| Smith Scott W | -- | Fidelity National Title Co | |
| Smith Scott W | -- | Fidelity National Title Co | |
| Smith Scott W | $259,000 | Fidelity National Title Co |
Source: Public Records
Mortgage History
| Date | Status | Borrower | Loan Amount |
|---|---|---|---|
| Open | Smith Scott W | $273,300 | |
| Closed | Smith Scott W | $252,434 |
Source: Public Records
Tax History Compared to Growth
Tax History
| Year | Tax Paid | Tax Assessment Tax Assessment Total Assessment is a certain percentage of the fair market value that is determined by local assessors to be the total taxable value of land and additions on the property. | Land | Improvement |
|---|---|---|---|---|
| 2025 | $3,628 | $331,811 | $108,894 | $222,917 |
| 2023 | $3,628 | $318,928 | $104,666 | $214,262 |
| 2022 | $3,565 | $312,675 | $102,614 | $210,061 |
| 2021 | $3,605 | $306,545 | $100,602 | $205,943 |
| 2020 | $3,566 | $303,403 | $99,571 | $203,832 |
| 2019 | $3,508 | $297,455 | $97,619 | $199,836 |
| 2018 | $3,454 | $291,623 | $95,705 | $195,918 |
| 2017 | $3,391 | $285,906 | $93,829 | $192,077 |
| 2016 | $3,330 | $280,301 | $91,990 | $188,311 |
| 2015 | $3,306 | $276,092 | $90,609 | $185,483 |
| 2014 | $3,259 | $270,685 | $88,835 | $181,850 |
Source: Public Records
Map
Nearby Homes
- 1317 N V St Unit 182
- 1317 N V St Unit 76
- 1006 Tranquillion Ct
- 1104 Honda Way
- 1429 Glen Ellen Ln
- 1213 Meridian Way
- 1236 Jason Dr
- 1121 Bellflower Ln
- 906 N P St
- 1212 W Prune Ave
- 500 N Z St
- 1265 Stonebrook Dr
- 1320 Stonebrook Dr
- 816 N O St Unit 113
- 1241 Stonebrook Dr
- 1426 Plum Ave
- 905 N L St
- 328 N X St
- 1035 W Central Ave
- 531 N O St