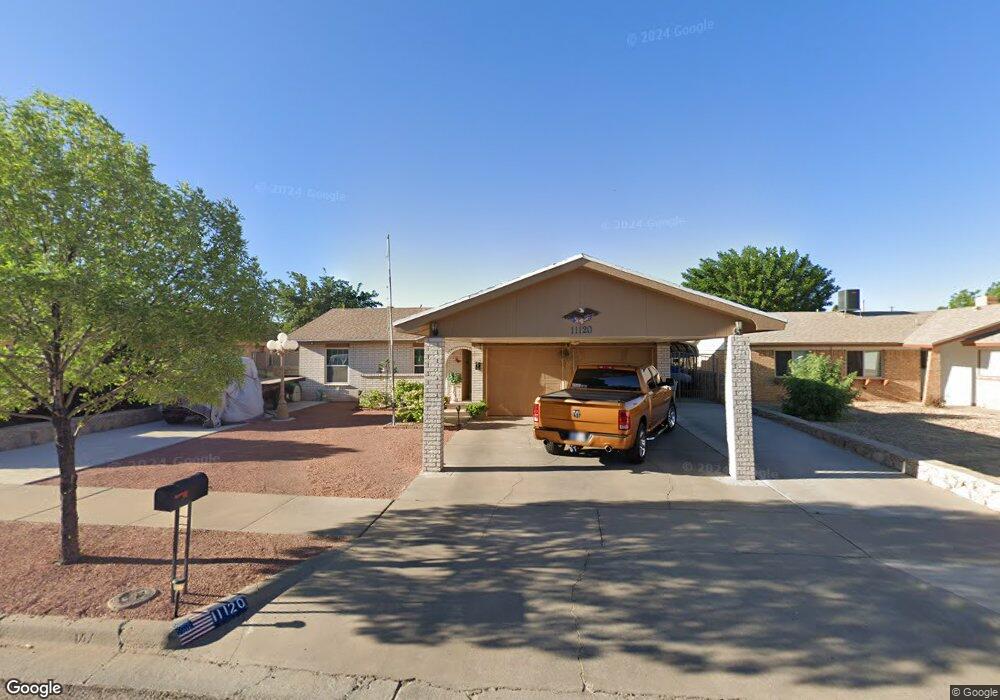
11120 Tahoka Ave El Paso, TX 79936
Indian Ridge NeighborhoodEstimated Value: $196,000 - $207,715
3
Beds
2
Baths
1,266
Sq Ft
$160/Sq Ft
Est. Value
About This Home
This home is located at 11120 Tahoka Ave, El Paso, TX 79936 and is currently estimated at $202,429, approximately $159 per square foot. 11120 Tahoka Ave is a home located in El Paso County with nearby schools including Pebble Hills Elementary School, J.M. Hanks Middle School, and J M Hanks High School.
Ownership History
Date
Name
Owned For
Owner Type
Purchase Details
Closed on
Oct 7, 2016
Sold by
Tapia James
Bought by
Tapia James and Tapia Maria R
Current Estimated Value
Home Financials for this Owner
Home Financials are based on the most recent Mortgage that was taken out on this home.
Original Mortgage
$115,368
Outstanding Balance
$92,606
Interest Rate
3.5%
Mortgage Type
FHA
Estimated Equity
$109,823
Purchase Details
Closed on
Feb 16, 2007
Sold by
Shannon Belinda M and Shannon Belinda Marie
Bought by
Tapia James
Home Financials for this Owner
Home Financials are based on the most recent Mortgage that was taken out on this home.
Original Mortgage
$110,662
Interest Rate
9.62%
Mortgage Type
Purchase Money Mortgage
Purchase Details
Closed on
Feb 12, 2007
Sold by
Shannon Michael J
Bought by
Shannon Belinda M and Shannon Belinda Marie
Home Financials for this Owner
Home Financials are based on the most recent Mortgage that was taken out on this home.
Original Mortgage
$110,662
Interest Rate
9.62%
Mortgage Type
Purchase Money Mortgage
Create a Home Valuation Report for This Property
The Home Valuation Report is an in-depth analysis detailing your home's value as well as a comparison with similar homes in the area
Home Values in the Area
Average Home Value in this Area
Purchase History
| Date | Buyer | Sale Price | Title Company |
|---|---|---|---|
| Tapia James | -- | Texas Title | |
| Tapia James | -- | None Available | |
| Shannon Belinda M | -- | None Available |
Source: Public Records
Mortgage History
| Date | Status | Borrower | Loan Amount |
|---|---|---|---|
| Open | Tapia James | $115,368 | |
| Previous Owner | Tapia James | $110,662 |
Source: Public Records
Tax History Compared to Growth
Tax History
| Year | Tax Paid | Tax Assessment Tax Assessment Total Assessment is a certain percentage of the fair market value that is determined by local assessors to be the total taxable value of land and additions on the property. | Land | Improvement |
|---|---|---|---|---|
| 2025 | $3,258 | $201,474 | -- | -- |
| 2024 | $3,258 | $183,158 | -- | -- |
| 2023 | $3,020 | $166,507 | $0 | $0 |
| 2022 | $4,701 | $151,370 | $0 | $0 |
| 2021 | $4,473 | $139,649 | $19,549 | $120,100 |
| 2020 | $3,951 | $125,099 | $17,444 | $107,655 |
| 2018 | $3,859 | $124,096 | $17,444 | $106,652 |
| 2017 | $3,467 | $113,421 | $17,444 | $95,977 |
| 2016 | $3,467 | $113,421 | $17,444 | $95,977 |
| 2015 | $2,583 | $118,937 | $17,444 | $101,493 |
| 2014 | $2,583 | $109,864 | $17,444 | $92,420 |
Source: Public Records
Map
Nearby Homes
- 11165 Shiner Ave
- 11189 Childress Ave
- 11025 Sunshine Ct
- 11016 Aqua Ct
- 3428 Itasca St
- 3332 Mclean St
- 3316 Slocum St
- 3651 George Dieter Dr
- 11273 Ivanhoe Dr
- 11254 Montana Ave
- 11272 Ivanhoe Dr
- 3319 Menard Ln
- 10905 Sagebrush Way Unit A & B
- 3205 Amarillo St
- 3324 Kilgore Place
- 3229 E Glen Dr
- 10816 Cardigan Dr
- 3121 Red Sails Dr
- 11237 Pony Soldier Ave
- 11312 Ardelle Ave
- 11124 Tahoka Ave
- 11116 Tahoka Ave
- 11121 Tenaha Ave
- 11117 Tenaha Ave
- 11125 Tenaha Ave
- 11128 Tahoka Ave
- 11112 Tahoka Ave
- 11129 Tenaha Ave
- 11113 Tenaha Ave
- 11121 Tahoka Ave
- 11117 Tahoka Ave
- 11132 Tahoka Ave
- 11108 Tahoka Ave
- 11113 Tahoka Ave
- 11129 Tahoka Ave
- 11133 Tenaha Ave
- 11109 Tenaha Ave
- 11136 Tahoka Ave
- 11104 Tahoka Ave
- 11133 Tahoka Ave