Estimated Value: $882,000 - $1,029,000
4
Beds
4
Baths
3,292
Sq Ft
$281/Sq Ft
Est. Value
About This Home
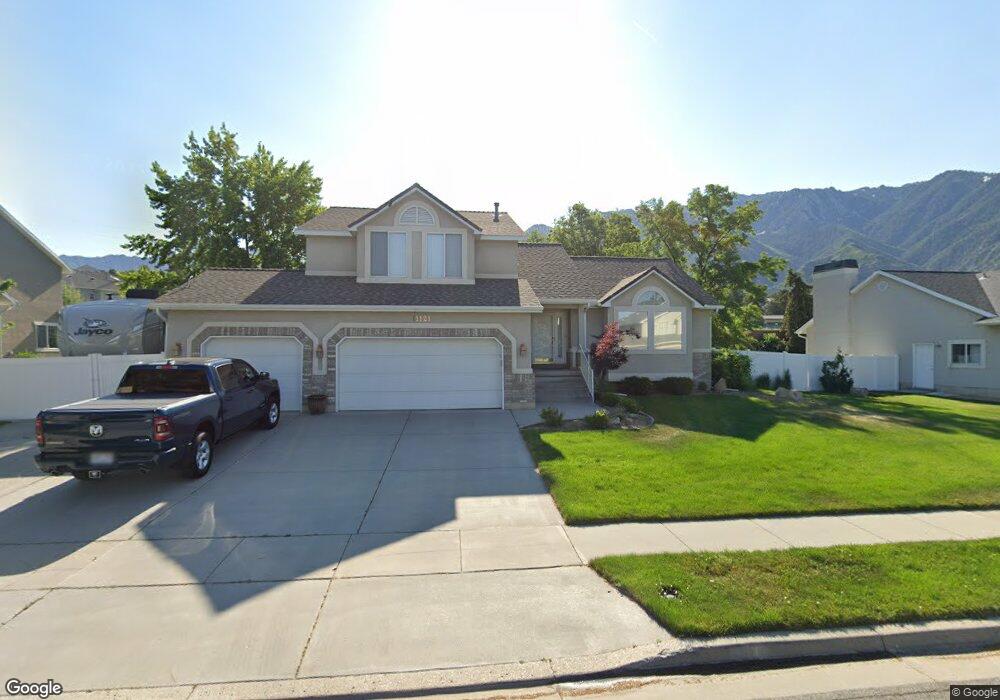
This home is located at 11121 Tall Pines Way, Sandy, UT 84092 and is currently estimated at $925,759, approximately $281 per square foot. 11121 Tall Pines Way is a home located in Salt Lake County with nearby schools including Sunrise Elementary School, Bell Canyon Montessori School, and Challenger School - Sandy.
Ownership History
Date
Name
Owned For
Owner Type
Purchase Details
Closed on
Nov 9, 2020
Sold by
Johns Mitchell J and Leandro Jessica L
Bought by
Johns Mitchell J and Johns Jessica L
Current Estimated Value
Home Financials for this Owner
Home Financials are based on the most recent Mortgage that was taken out on this home.
Original Mortgage
$377,000
Outstanding Balance
$304,200
Interest Rate
2.8%
Mortgage Type
New Conventional
Estimated Equity
$621,559
Purchase Details
Closed on
Jan 3, 2018
Sold by
Rands George Alex
Bought by
Johns Mithcell L and Leandro Jessica L
Home Financials for this Owner
Home Financials are based on the most recent Mortgage that was taken out on this home.
Original Mortgage
$394,200
Interest Rate
3.94%
Mortgage Type
New Conventional
Purchase Details
Closed on
Dec 17, 2015
Sold by
Whitehaed Heidi M
Bought by
Rands George Alex
Home Financials for this Owner
Home Financials are based on the most recent Mortgage that was taken out on this home.
Original Mortgage
$330,000
Interest Rate
3.96%
Mortgage Type
New Conventional
Purchase Details
Closed on
Nov 21, 2011
Sold by
Whitehead Heidi M
Bought by
Rands Heidi M
Home Financials for this Owner
Home Financials are based on the most recent Mortgage that was taken out on this home.
Original Mortgage
$282,000
Interest Rate
4.09%
Mortgage Type
New Conventional
Purchase Details
Closed on
Jul 2, 2007
Sold by
Whitehead Heidi M
Bought by
Whitehead Heidi M
Home Financials for this Owner
Home Financials are based on the most recent Mortgage that was taken out on this home.
Original Mortgage
$320,000
Interest Rate
6.36%
Mortgage Type
New Conventional
Purchase Details
Closed on
May 24, 2006
Sold by
Whitehead Kent C and Whitehead Heidi M
Bought by
Whitehead Heidi M
Home Financials for this Owner
Home Financials are based on the most recent Mortgage that was taken out on this home.
Original Mortgage
$306,500
Interest Rate
7.37%
Mortgage Type
Fannie Mae Freddie Mac
Purchase Details
Closed on
Jun 13, 2000
Sold by
Dent Danny S and Dent Kimberly A
Bought by
Reddick Dana L and Venenga Roxane S
Home Financials for this Owner
Home Financials are based on the most recent Mortgage that was taken out on this home.
Original Mortgage
$232,000
Interest Rate
7.5%
Purchase Details
Closed on
Mar 25, 1994
Sold by
Newmark Development Inc
Bought by
Dent Danny S and Dent Kimberly A
Home Financials for this Owner
Home Financials are based on the most recent Mortgage that was taken out on this home.
Original Mortgage
$161,600
Interest Rate
7.21%
Create a Home Valuation Report for This Property
The Home Valuation Report is an in-depth analysis detailing your home's value as well as a comparison with similar homes in the area
Home Values in the Area
Average Home Value in this Area
Purchase History
| Date | Buyer | Sale Price | Title Company |
|---|---|---|---|
| Johns Mitchell J | -- | Title Guarantee | |
| Johns Mithcell L | -- | Stewart Title Ins Agcy Of Ut | |
| Rands George Alex | -- | Citadel Title & Esrow | |
| Rands Heidi M | -- | Citadel Title & Escrow | |
| Whitehead Heidi M | -- | Premier Title Ins Agency | |
| Whitehead Heidi M | -- | Premier Title Ins Agency | |
| Reddick Dana L | -- | Merrill Title | |
| Dent Danny S | -- | -- |
Source: Public Records
Mortgage History
| Date | Status | Borrower | Loan Amount |
|---|---|---|---|
| Open | Johns Mitchell J | $377,000 | |
| Closed | Johns Mithcell L | $394,200 | |
| Previous Owner | Rands George Alex | $330,000 | |
| Previous Owner | Rands Heidi M | $282,000 | |
| Previous Owner | Whitehead Heidi M | $320,000 | |
| Previous Owner | Whitehead Heidi M | $306,500 | |
| Previous Owner | Reddick Dana L | $232,000 | |
| Previous Owner | Dent Danny S | $161,600 | |
| Closed | Reddick Dana L | $14,500 |
Source: Public Records
Tax History Compared to Growth
Tax History
| Year | Tax Paid | Tax Assessment Tax Assessment Total Assessment is a certain percentage of the fair market value that is determined by local assessors to be the total taxable value of land and additions on the property. | Land | Improvement |
|---|---|---|---|---|
| 2025 | $4,266 | $821,200 | $327,500 | $493,700 |
| 2024 | $4,266 | $788,900 | $315,300 | $473,600 |
| 2023 | $3,888 | $716,900 | $303,200 | $413,700 |
| 2022 | $3,965 | $714,200 | $297,300 | $416,900 |
| 2021 | $3,220 | $493,700 | $246,000 | $247,700 |
| 2020 | $3,367 | $486,800 | $246,000 | $240,800 |
| 2019 | $3,241 | $456,700 | $237,200 | $219,500 |
| 2018 | $2,984 | $437,800 | $237,200 | $200,600 |
| 2017 | $3,064 | $429,400 | $237,200 | $192,200 |
| 2016 | $3,133 | $424,500 | $213,700 | $210,800 |
| 2015 | $3,227 | $404,600 | $220,100 | $184,500 |
| 2014 | $3,233 | $397,300 | $220,100 | $177,200 |
Source: Public Records
Map
Nearby Homes
- 2022 Tall Pines Way
- 15 Lone Hollow Dr
- 2234 E Willow Brook Way
- 11458 Lexington Hills Dr
- 5 Quietwood Ln
- 11065 Longdale Cir
- 1937 Wasatch Blvd
- 2125 Dimple Dell Rd
- 10665 S 2340 E
- 98 E Lone Hollow Dr S Unit 902
- 10868 Prescott Dr
- 2058 E Oak Manor Dr
- 1 Pepperwood Pointe
- 39 Northridge Way
- 11415 S Hagan Rd
- 1 Cross Hill Ln
- 1612 E Hidden Valley Rd
- 11545 S Hagan Rd
- 11778 S 1700 E
- 89 Lone Hollow Dr Unit 1026
- 11121 S Tall Pines Way
- 11133 Tall Pines Way
- 11103 S Tall Pines Way
- 11118 S Tall Pines Way
- 11118 Tall Pines Way
- 11118 S Tall Pines Way
- 11134 Tall Pines Way
- 11145 S Tall Pines Way
- 11145 Tall Pines Way
- 11145 S Tall Pines Way
- 2032 E Justin Park Dr
- 11083 S Tall Pines Way
- 11146 Tall Pines Way
- 2088 E Pleasant Valley Ct
- 11135 Barrett Park Cir
- 11135 S Barrett Park Cir
- 11127 Barrett Park Cir
- 2016 E Justin Park Dr
- 2016 E Justin Park Dr
- 11143 E Barrett Park Cir