R
Seller's Agent in 2014
Ryan Boyer
RE/MAX
Estimated Value: $313,000 - $347,586
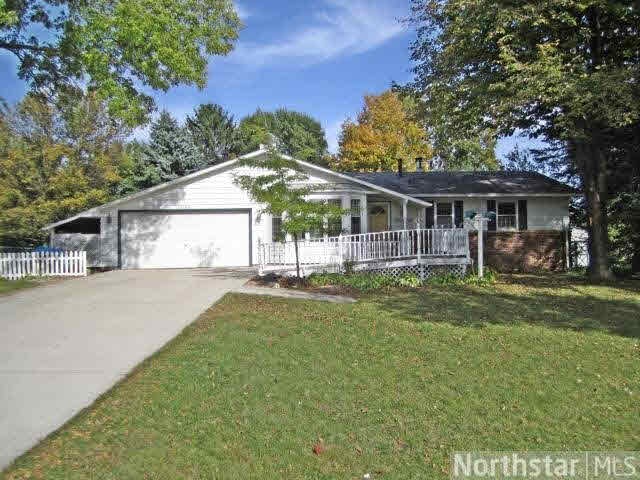
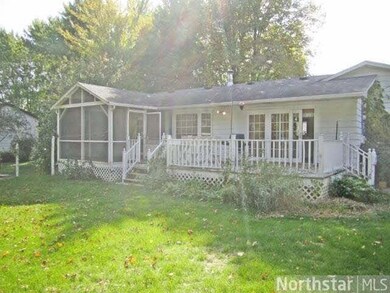
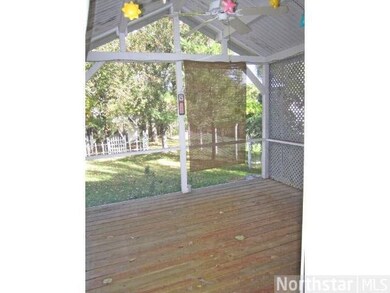
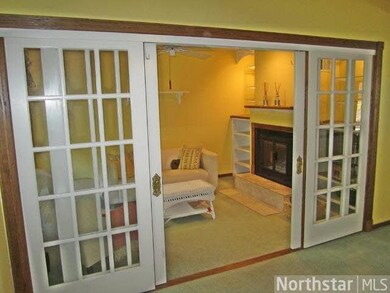
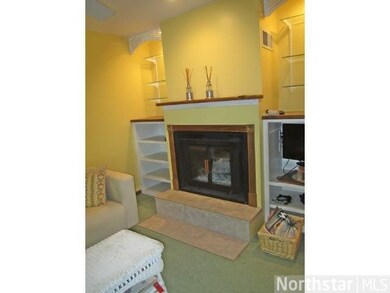
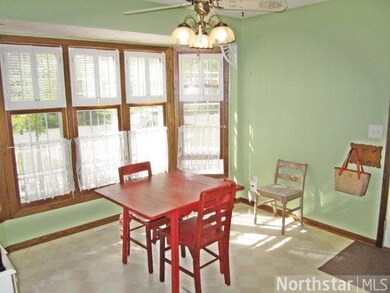
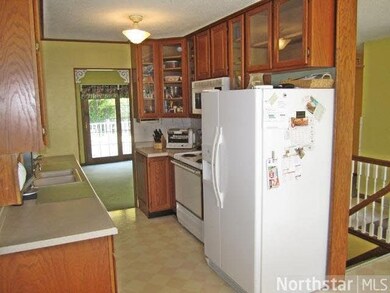
Large open layout with vaulted ceilings, 2 season porch off of the master BR, excellent condition, finished lower level, lower level bedrooms are non conforming need egress window.
Last Agent to Sell the Property
Ryan Boyer
RE/MAX Results Listed on: 10/08/2013
Last Buyer's Agent
Teddy Morse
eGreen Realty & Property Mgmt
| Date | Buyer | Sale Price | Title Company |
|---|---|---|---|
| Vanwyk Derek W | $168,500 | Liberty Title Inc |
| Date | Status | Borrower | Loan Amount |
|---|---|---|---|
| Open | Vanwyk Derek W | $165,400 |
| Date | Event | Price | List to Sale | Price per Sq Ft |
|---|---|---|---|---|
| 02/14/2014 02/14/14 | Sold | $168,500 | -8.9% | $89 / Sq Ft |
| 01/06/2014 01/06/14 | Pending | -- | -- | -- |
| 10/08/2013 10/08/13 | For Sale | $184,900 | -- | $98 / Sq Ft |
| Year | Tax Paid | Tax Assessment Tax Assessment Total Assessment is a certain percentage of the fair market value that is determined by local assessors to be the total taxable value of land and additions on the property. | Land | Improvement |
|---|---|---|---|---|
| 2024 | $3,681 | $322,200 | $95,000 | $227,200 |
| 2023 | $3,549 | $316,800 | $89,000 | $227,800 |
| 2022 | $3,112 | $290,000 | $83,000 | $207,000 |
| 2021 | $2,982 | $258,000 | $62,000 | $196,000 |
| 2020 | $3,042 | $247,000 | $58,000 | $189,000 |
| 2019 | $2,870 | $246,000 | $58,000 | $188,000 |
| 2018 | $2,724 | $230,000 | $52,000 | $178,000 |
| 2017 | $2,367 | $190,000 | $40,000 | $150,000 |
| 2016 | $2,322 | $181,000 | $45,000 | $136,000 |
| 2015 | $2,437 | $188,000 | $55,000 | $133,000 |
| 2014 | -- | $168,000 | $50,000 | $118,000 |
R
Seller's Agent in 2014
Ryan Boyer
RE/MAX
T
Buyer's Agent in 2014
Teddy Morse
eGreen Realty & Property Mgmt
Source: REALTOR® Association of Southern Minnesota
MLS Number: 4549597
APN: 31-120-21-33-0068
Disclaimer: Certain information contained herein is derived from information provided by parties other than Homes.com. All information provided is deemed reliable, but is not guaranteed to be accurate and should be independently verified.
![]() IDX information is provided exclusively for personal, non-commercial use, and may not be used for any purpose other than to identify prospective properties consumers may be interested in purchasing. Information is deemed reliable but not guaranteed.
IDX information is provided exclusively for personal, non-commercial use, and may not be used for any purpose other than to identify prospective properties consumers may be interested in purchasing. Information is deemed reliable but not guaranteed.
Ask me questions while you tour the home.