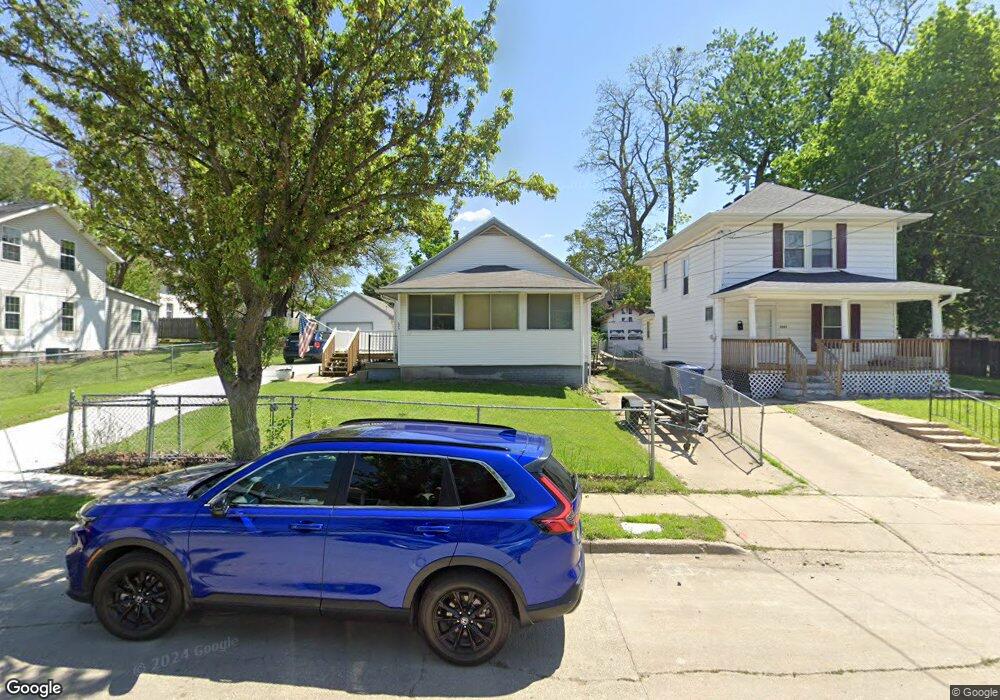
1113 11th St Des Moines, IA 50314
Cheatom Park NeighborhoodEstimated Value: $101,000 - $141,000
2
Beds
1
Bath
660
Sq Ft
$182/Sq Ft
Est. Value
About This Home
This home is located at 1113 11th St, Des Moines, IA 50314 and is currently estimated at $120,333, approximately $182 per square foot. 1113 11th St is a home located in Polk County with nearby schools including Moulton Elementary School, Harding Middle School, and North High School.
Ownership History
Date
Name
Owned For
Owner Type
Purchase Details
Closed on
Mar 15, 2022
Sold by
Housebuyers Llc
Bought by
M & B Scott Properties Llc
Current Estimated Value
Home Financials for this Owner
Home Financials are based on the most recent Mortgage that was taken out on this home.
Original Mortgage
$1,000,000
Outstanding Balance
$866,400
Interest Rate
3.09%
Mortgage Type
New Conventional
Estimated Equity
-$746,067
Purchase Details
Closed on
Jul 22, 2014
Sold by
The Estate Of Iris Ward
Bought by
Housebuyers Llc
Purchase Details
Closed on
May 17, 2012
Sold by
Estate Of Iris Ward
Bought by
Housebuyers Llc
Purchase Details
Closed on
Dec 22, 2004
Sold by
Cheatom Catriyanna E and Cheatom Octravia
Bought by
Ward Iris
Create a Home Valuation Report for This Property
The Home Valuation Report is an in-depth analysis detailing your home's value as well as a comparison with similar homes in the area
Home Values in the Area
Average Home Value in this Area
Purchase History
| Date | Buyer | Sale Price | Title Company |
|---|---|---|---|
| M & B Scott Properties Llc | $1,070,000 | Belin Mccormick Pc | |
| Housebuyers Llc | -- | None Available | |
| Housebuyers Llc | $13,532 | None Available | |
| Ward Iris | -- | -- |
Source: Public Records
Mortgage History
| Date | Status | Borrower | Loan Amount |
|---|---|---|---|
| Open | M & B Scott Properties Llc | $1,000,000 |
Source: Public Records
Tax History Compared to Growth
Tax History
| Year | Tax Paid | Tax Assessment Tax Assessment Total Assessment is a certain percentage of the fair market value that is determined by local assessors to be the total taxable value of land and additions on the property. | Land | Improvement |
|---|---|---|---|---|
| 2025 | $1,332 | $78,700 | $13,200 | $65,500 |
| 2024 | $1,332 | $67,700 | $11,300 | $56,400 |
| 2023 | $1,152 | $67,700 | $11,300 | $56,400 |
| 2022 | $1,144 | $48,900 | $8,600 | $40,300 |
| 2021 | $1,080 | $48,900 | $8,600 | $40,300 |
| 2020 | $1,122 | $43,300 | $7,600 | $35,700 |
| 2019 | $1,054 | $43,300 | $7,600 | $35,700 |
| 2018 | $1,042 | $39,200 | $6,800 | $32,400 |
| 2017 | $1,066 | $39,200 | $6,800 | $32,400 |
| 2016 | $1,038 | $39,400 | $6,800 | $32,600 |
| 2015 | $1,038 | $39,400 | $6,800 | $32,600 |
| 2014 | $916 | $34,500 | $6,500 | $28,000 |
Source: Public Records
Map
Nearby Homes
- 1004 Laurel St Unit 18
- 1167 11th St
- 1021 11th St Unit 9
- 1003 Day St Unit 23
- 1001 Day St Unit 24
- 1162 13th St
- 1054 14th St
- 1251 10th St
- 0000 Keosauqua Way
- 1311 10th St
- 1414 Goddard Ct
- 1315 7th St
- 1505 University Ave
- 1221 Forest Ave
- 1235 5th Ave
- 1420 10th St
- 1420 9th St
- 1418 8th St
- 1423 12th St
- 1241 4th St