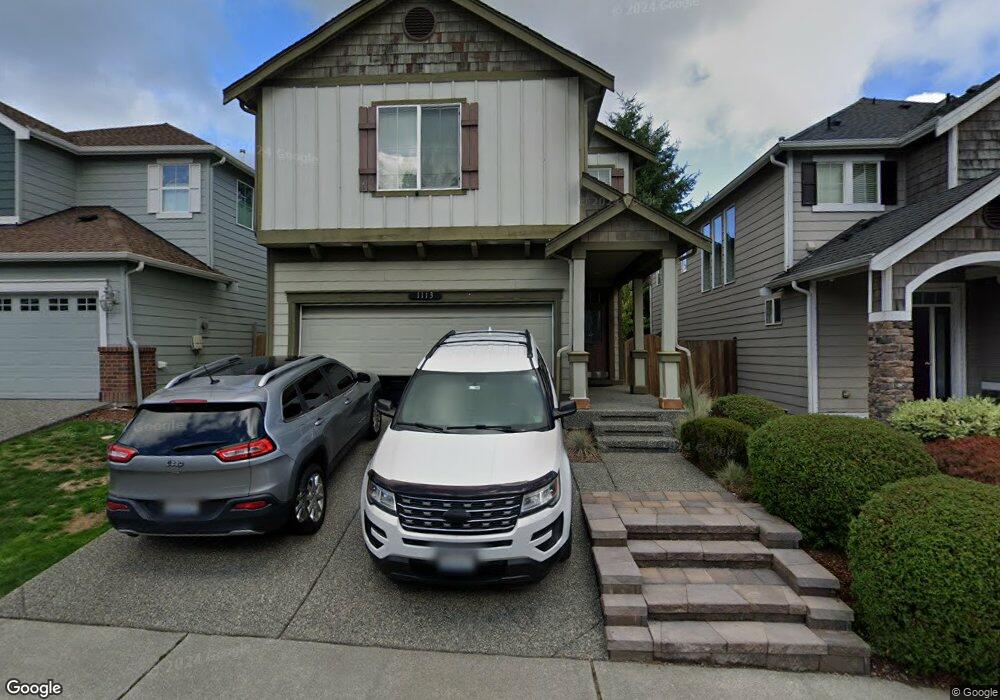
1113 167th Place SW Lynnwood, WA 98037
Estimated Value: $734,374 - $879,000
3
Beds
3
Baths
1,754
Sq Ft
$464/Sq Ft
Est. Value
About This Home
This home is located at 1113 167th Place SW, Lynnwood, WA 98037 and is currently estimated at $814,094, approximately $464 per square foot. 1113 167th Place SW is a home located in Snohomish County with nearby schools including Martha Lake Elementary School, Alderwood Middle School, and Lynnwood High School.
Ownership History
Date
Name
Owned For
Owner Type
Purchase Details
Closed on
Apr 23, 2019
Sold by
Iverson Jarod Benjamin
Bought by
Iverson Jarod Benjamin and Iverson Nicole
Current Estimated Value
Home Financials for this Owner
Home Financials are based on the most recent Mortgage that was taken out on this home.
Original Mortgage
$382,500
Outstanding Balance
$336,285
Interest Rate
4.3%
Mortgage Type
New Conventional
Estimated Equity
$477,809
Purchase Details
Closed on
Nov 26, 2012
Sold by
Iverson Nicole L
Bought by
Iverson Jarod
Home Financials for this Owner
Home Financials are based on the most recent Mortgage that was taken out on this home.
Original Mortgage
$354,000
Interest Rate
3.33%
Mortgage Type
New Conventional
Purchase Details
Closed on
Sep 16, 2007
Sold by
Sshi Llc
Bought by
Iverson Jarod
Home Financials for this Owner
Home Financials are based on the most recent Mortgage that was taken out on this home.
Original Mortgage
$350,108
Interest Rate
6.57%
Mortgage Type
Purchase Money Mortgage
Create a Home Valuation Report for This Property
The Home Valuation Report is an in-depth analysis detailing your home's value as well as a comparison with similar homes in the area
Home Values in the Area
Average Home Value in this Area
Purchase History
| Date | Buyer | Sale Price | Title Company |
|---|---|---|---|
| Iverson Jarod Benjamin | -- | First American Title | |
| Iverson Jarod | -- | Wfg National Title | |
| Iverson Jarod | $411,892 | Chicago Title |
Source: Public Records
Mortgage History
| Date | Status | Borrower | Loan Amount |
|---|---|---|---|
| Open | Iverson Jarod Benjamin | $382,500 | |
| Closed | Iverson Jarod | $354,000 | |
| Closed | Iverson Jarod | $350,108 |
Source: Public Records
Tax History Compared to Growth
Tax History
| Year | Tax Paid | Tax Assessment Tax Assessment Total Assessment is a certain percentage of the fair market value that is determined by local assessors to be the total taxable value of land and additions on the property. | Land | Improvement |
|---|---|---|---|---|
| 2025 | $5,657 | $720,600 | $458,000 | $262,600 |
| 2024 | $5,657 | $681,500 | $428,000 | $253,500 |
| 2023 | $6,076 | $766,600 | $475,000 | $291,600 |
| 2022 | $5,551 | $569,700 | $302,000 | $267,700 |
| 2020 | $5,871 | $533,400 | $307,000 | $226,400 |
| 2019 | $5,144 | $464,300 | $240,000 | $224,300 |
| 2018 | $5,278 | $420,100 | $200,000 | $220,100 |
| 2017 | $4,459 | $367,000 | $160,000 | $207,000 |
| 2016 | $3,981 | $328,300 | $130,000 | $198,300 |
| 2015 | $3,914 | $306,700 | $112,000 | $194,700 |
| 2013 | $3,150 | $233,300 | $92,000 | $141,300 |
Source: Public Records
Map
Nearby Homes
- 1410 169th Place SW
- 16820 6th Ave W Unit A5
- 17217 Larch Way
- 16918 6th Ave W
- 17133 7th Place W
- 1603 169th Place SW
- 17009 17th Ave W
- 16126 Larch Way
- 1233 160th St SW
- 17429 17th Ave W
- 17624 12th Place W
- 17121 3rd Place W Unit 7
- 17521 7th Ave W
- 110 169th Place SW Unit B
- 110 169th Place SW Unit A
- 122 169th Place SW Unit B
- 122 169th Place SW Unit A
- 118 169th Place SW Unit B
- 114 169th Place SW Unit B
- 1622 175th St SW
- 1115 167th Place SW Unit 4
- 1115 167th Place SW
- 1103 167th Place SW Unit 1
- 1103 167th Place SW
- 1119 167th Place SW Unit 5
- 1132 167th St SW
- 1121 167th Place SW
- 1114 167th Place SW
- 1110 167th Place SW
- 1128 167th St SW
- 1106 167th Place SW
- 16718 10th Place W
- 1123 167th Place SW Unit 7
- 1102 167th Place SW Unit 15
- 1133 167th St SW
- 1028 167th Place SW Unit 16
- 1028 167th Place SW
- 1129 167th Place SW
- 1127 167th Place SW