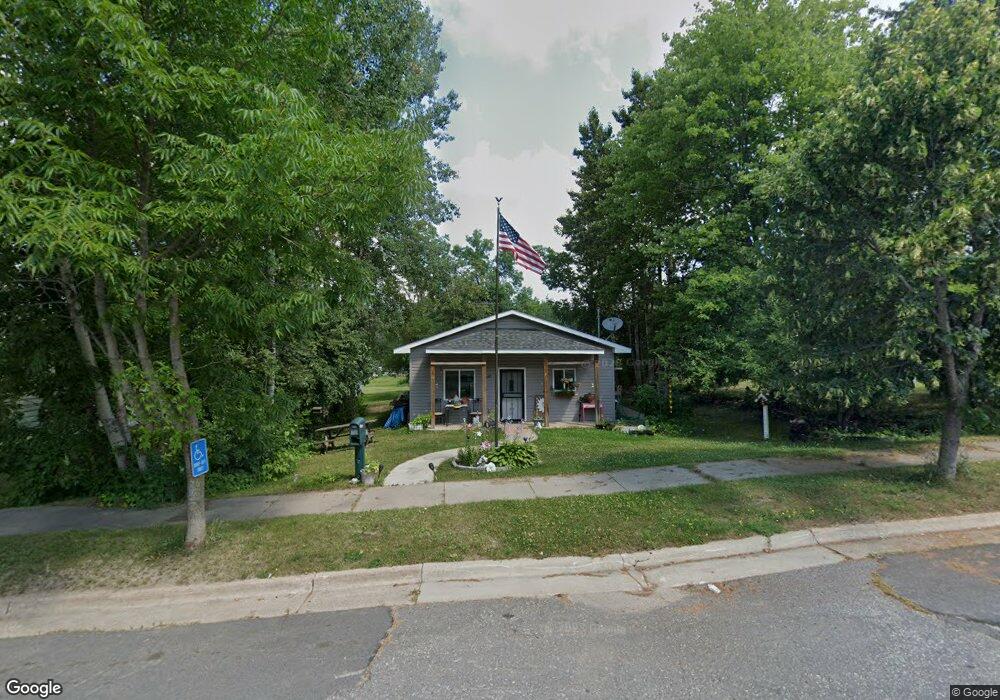
1113 2nd St W Eveleth, MN 55734
Estimated Value: $160,000 - $242,000
3
Beds
1
Bath
1,092
Sq Ft
$168/Sq Ft
Est. Value
About This Home
This home is located at 1113 2nd St W, Eveleth, MN 55734 and is currently estimated at $183,972, approximately $168 per square foot. 1113 2nd St W is a home with nearby schools including Nelle Shean Elementary School, Franklin Elementary School, and Eveleth-Gilbert Junior High School.
Ownership History
Date
Name
Owned For
Owner Type
Purchase Details
Closed on
Jul 10, 2013
Sold by
North St Louis County Habitat For Humani
Bought by
Manley Megan R
Current Estimated Value
Home Financials for this Owner
Home Financials are based on the most recent Mortgage that was taken out on this home.
Original Mortgage
$80,000
Outstanding Balance
$57,950
Interest Rate
3.83%
Mortgage Type
Seller Take Back
Estimated Equity
$126,022
Purchase Details
Closed on
Jul 6, 2012
Sold by
City Of Eveleth
Bought by
North St Louis County Habitat For Humani
Create a Home Valuation Report for This Property
The Home Valuation Report is an in-depth analysis detailing your home's value as well as a comparison with similar homes in the area
Home Values in the Area
Average Home Value in this Area
Purchase History
| Date | Buyer | Sale Price | Title Company |
|---|---|---|---|
| Manley Megan R | $110,000 | None Available | |
| North St Louis County Habitat For Humani | -- | None Available |
Source: Public Records
Mortgage History
| Date | Status | Borrower | Loan Amount |
|---|---|---|---|
| Open | Manley Megan R | $80,000 |
Source: Public Records
Tax History Compared to Growth
Tax History
| Year | Tax Paid | Tax Assessment Tax Assessment Total Assessment is a certain percentage of the fair market value that is determined by local assessors to be the total taxable value of land and additions on the property. | Land | Improvement |
|---|---|---|---|---|
| 2023 | $2,892 | $131,600 | $8,800 | $122,800 |
| 2022 | $696 | $101,200 | $8,000 | $93,200 |
| 2021 | $524 | $70,200 | $7,200 | $63,000 |
| 2020 | $574 | $64,500 | $7,200 | $57,300 |
| 2019 | $484 | $70,200 | $7,200 | $63,000 |
| 2018 | $444 | $70,200 | $7,200 | $63,000 |
| 2017 | $434 | $70,200 | $7,200 | $63,000 |
| 2016 | $390 | $67,700 | $7,600 | $60,100 |
| 2015 | $147 | $40,600 | $4,600 | $36,000 |
| 2014 | $147 | $26,000 | $4,600 | $21,400 |
Source: Public Records
Map
Nearby Homes