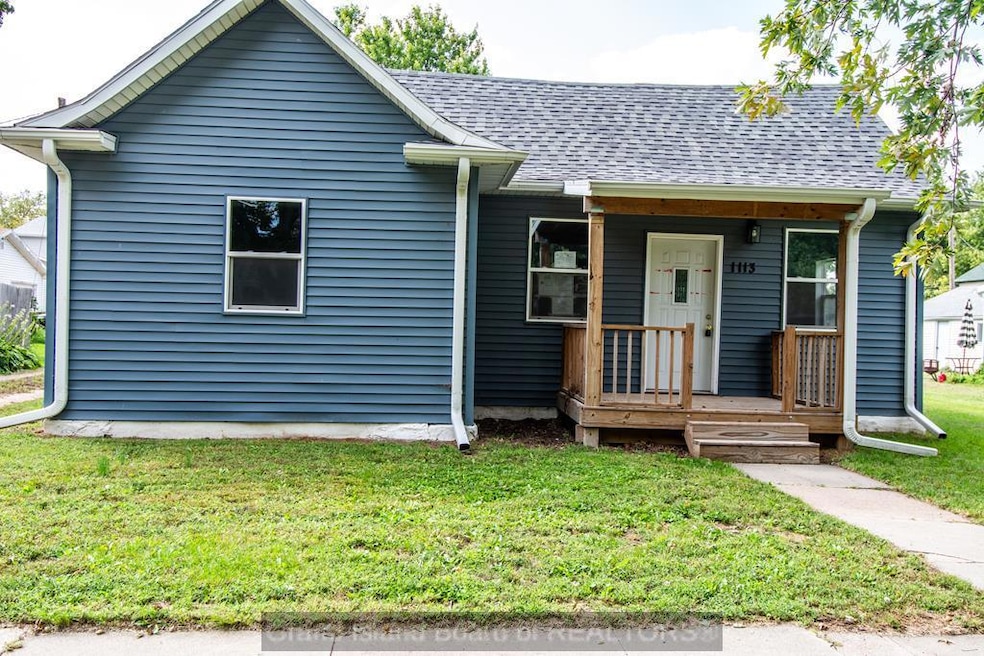
1113 6th St Aurora, NE 68818
Estimated payment $1,006/month
Highlights
- Ranch Style House
- Forced Air Heating System
- Vinyl Flooring
- Landscaped
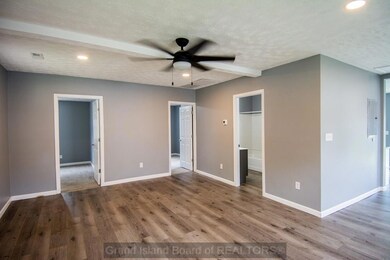
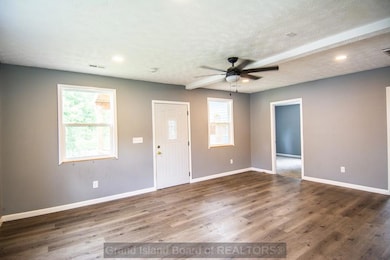
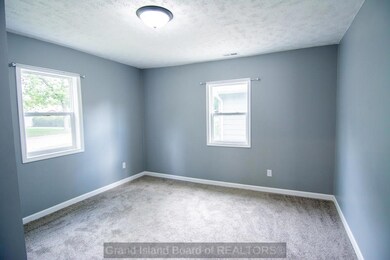
About This Home
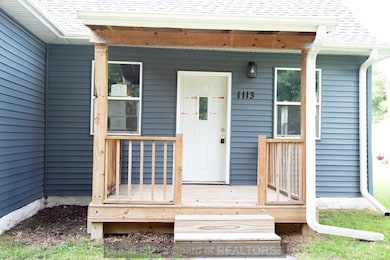
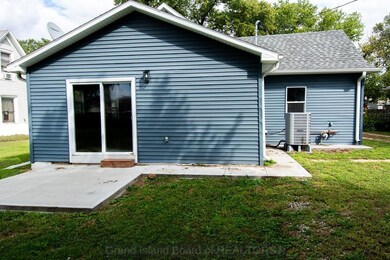
This 2 bed 1 bath home features a newer roof; siding is vinyl and newer; Kitchen is remodeled with newer appliances; Front Porch remodeled bath; newer carpet; luxury vinyl plank flooring is thruout most the home exception for bedroo; water heater is newer; furnace - AC in the attic; alley access to this lovely remodeled home. Call to set appointment to show. 402 730-6005 or 402 630-2775
Listing Agent
Exit Realty Professionals Brokerage Phone: 4024668181 License #20050625 Listed on: 11/07/2025

Home Details
Home Type
- Single Family
Est. Annual Taxes
- $1,335
Year Built
- Built in 1900
Lot Details
- 0.25 Acre Lot
- Lot Dimensions are 45 x 126
- Landscaped
- Property is zoned R1
Parking
- No Garage
Home Design
- Ranch Style House
- Composition Roof
- Vinyl Siding
Kitchen
- Electric Range
- Microwave
- Dishwasher
- Disposal
Bedrooms and Bathrooms
- 2 Main Level Bedrooms
- 1 Full Bathroom
Schools
- Aurora Elementary And Middle School
- Aurora High School
Utilities
- Forced Air Heating System
- Gas Water Heater
Additional Features
- Vinyl Flooring
- Laundry on main level
Community Details
- Ellsworth Addition Subdivision
Listing and Financial Details
- Assessor Parcel Number 410048275
Map
Home Values in the Area
Average Home Value in this Area
Tax History
| Year | Tax Paid | Tax Assessment Tax Assessment Total Assessment is a certain percentage of the fair market value that is determined by local assessors to be the total taxable value of land and additions on the property. | Land | Improvement |
|---|---|---|---|---|
| 2024 | $1,335 | $123,180 | $11,340 | $111,840 |
| 2023 | $1,608 | $113,945 | $11,340 | $102,605 |
| 2022 | $460 | $30,760 | $11,340 | $19,420 |
| 2021 | $468 | $30,760 | $11,340 | $19,420 |
| 2020 | $512 | $34,540 | $15,120 | $19,420 |
| 2019 | $487 | $33,100 | $15,120 | $17,980 |
| 2018 | $466 | $33,100 | $15,120 | $17,980 |
| 2017 | $413 | $29,320 | $11,340 | $17,980 |
| 2016 | $347 | $25,365 | $9,070 | $16,295 |
| 2010 | $481 | $25,365 | $0 | $0 |
Property History
| Date | Event | Price | List to Sale | Price per Sq Ft |
|---|---|---|---|---|
| 11/07/2025 11/07/25 | For Sale | $169,500 | -- | -- |
Purchase History
| Date | Type | Sale Price | Title Company |
|---|---|---|---|
| Special Warranty Deed | -- | None Listed On Document | |
| Trustee Deed | $138,683 | None Listed On Document | |
| Warranty Deed | $150,000 | Grand Island Abstract & Title | |
| Warranty Deed | $27,000 | None Listed On Document |
Mortgage History
| Date | Status | Loan Amount | Loan Type |
|---|---|---|---|
| Previous Owner | $153,450 | VA |
Source: Grand Island Board of REALTORS®
MLS Number: 20251109
APN: 0410048275
- 588 S Stuhr Rd
- 415 S Cherry St
- 200 E Us Highway 34
- 2208 Chanticleer St
- 2212 Chanticleer St
- 123 N Locust St Unit 502
- 504 N Elm St
- 409 S Madison St
- 115 W 13th St
- 611 N Adams St
- 2203 W Division St
- 603 Kennedy Dr Unit 603 Kennedy Drive Apt. #1
- 609 Kennedy Dr Unit 603 Kennedy Drive
- 2300 W Capital Ave
- 3601 Innate Cir
- 1113 N Claude Rd
- 1021 Starwood Ave
- 1204 Cedar Ridge Ct
- 3720 State St
- 3721 W Capital Ave