1113 Cypress Point Way Unit 104 Virginia Beach, VA 23455
Bayside NeighborhoodEstimated Value: $368,000 - $399,327
3
Beds
3
Baths
2,471
Sq Ft
$154/Sq Ft
Est. Value
About This Home
This home is located at 1113 Cypress Point Way Unit 104, Virginia Beach, VA 23455 and is currently estimated at $380,332, approximately $153 per square foot. 1113 Cypress Point Way Unit 104 is a home located in Virginia Beach City with nearby schools including Luxford Elementary School, Bayside 6th Grade Campus, and Bayside High School.
Ownership History
Date
Name
Owned For
Owner Type
Purchase Details
Closed on
Mar 21, 2019
Sold by
Hernandez Victor R and Hernandez Susan D
Bought by
Dennis David A and Dennis Teresa A
Current Estimated Value
Home Financials for this Owner
Home Financials are based on the most recent Mortgage that was taken out on this home.
Original Mortgage
$243,508
Outstanding Balance
$213,429
Interest Rate
4.25%
Mortgage Type
FHA
Estimated Equity
$166,903
Purchase Details
Closed on
Nov 9, 2016
Sold by
Callaman Ellen M
Bought by
Hernandez Victor R and Hernandez Susan D
Home Financials for this Owner
Home Financials are based on the most recent Mortgage that was taken out on this home.
Original Mortgage
$206,910
Interest Rate
3.54%
Mortgage Type
New Conventional
Purchase Details
Closed on
Mar 15, 2007
Sold by
Larsen Norman E
Bought by
Callahan William W
Create a Home Valuation Report for This Property
The Home Valuation Report is an in-depth analysis detailing your home's value as well as a comparison with similar homes in the area
Home Values in the Area
Average Home Value in this Area
Purchase History
| Date | Buyer | Sale Price | Title Company |
|---|---|---|---|
| Dennis David A | $248,000 | Attorney | |
| Hernandez Victor R | $229,900 | Title Alliance Greenbrier | |
| Callahan William W | $328,300 | -- |
Source: Public Records
Mortgage History
| Date | Status | Borrower | Loan Amount |
|---|---|---|---|
| Open | Dennis David A | $243,508 | |
| Previous Owner | Hernandez Victor R | $206,910 |
Source: Public Records
Tax History Compared to Growth
Tax History
| Year | Tax Paid | Tax Assessment Tax Assessment Total Assessment is a certain percentage of the fair market value that is determined by local assessors to be the total taxable value of land and additions on the property. | Land | Improvement |
|---|---|---|---|---|
| 2025 | $3,412 | $358,800 | $115,000 | $243,800 |
| 2024 | $3,412 | $351,800 | $115,000 | $236,800 |
| 2023 | $2,979 | $300,900 | $100,000 | $200,900 |
| 2022 | $2,653 | $268,000 | $85,000 | $183,000 |
| 2021 | $2,407 | $243,100 | $66,000 | $177,100 |
| 2020 | $2,415 | $237,300 | $66,000 | $171,300 |
| 2019 | $2,350 | $227,500 | $66,000 | $161,500 |
| 2018 | $2,281 | $227,500 | $66,000 | $161,500 |
| 2017 | $2,281 | $227,500 | $66,000 | $161,500 |
| 2016 | $2,113 | $213,400 | $63,300 | $150,100 |
| 2015 | $2,014 | $203,400 | $63,300 | $140,100 |
| 2014 | $2,073 | $201,900 | $67,300 | $134,600 |
Source: Public Records
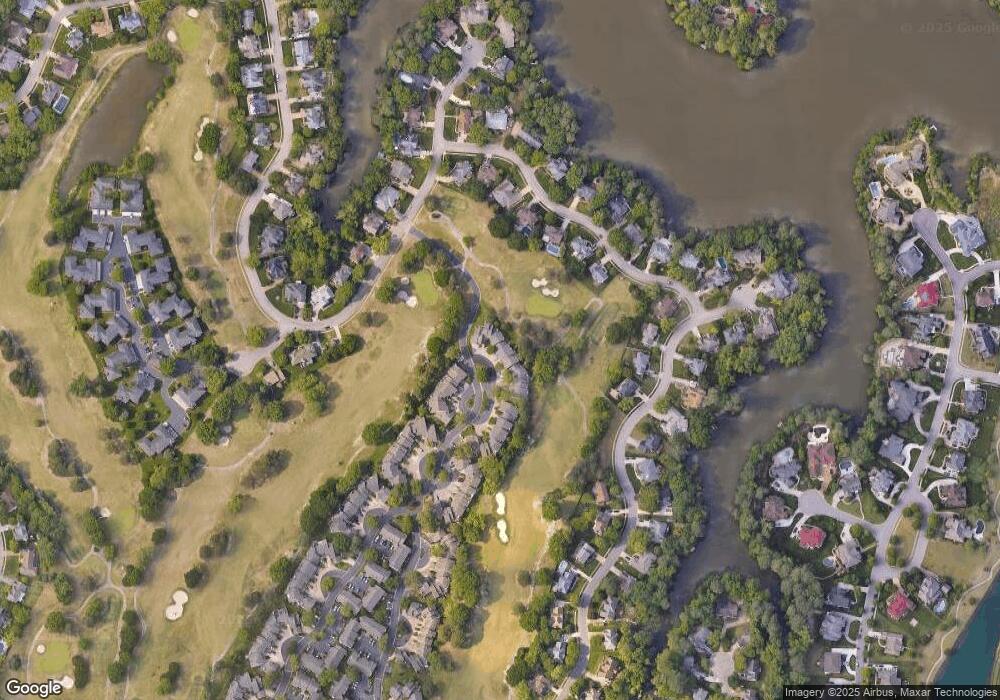
Map
Nearby Homes
- 1152 Cypress Point Way
- 1172 Cypress Point Way
- 4980 Cypress Point Cir Unit 204
- 1226 Foursome Ln
- 1256 Foursome Ln
- 1265 Foursome Ln
- 1267 Foursome Ln
- 5183 Cypress Point Cir
- 4919 Cypress Point Cir
- 5237 Battersea Ct
- 5205 Woolwich Ct
- 1101 Knights Bridge Ln
- 5256 Club Head Rd
- 5016 Madeira Rd
- 828 de La Fayette Ct
- 5345 Club Head Rd
- 1072 Grand Oak Ln
- 5301 Brinsley Ln Unit 5301B
- 4712 Crossborough Rd
- 1133 Broadholme Place
- 1117 Cypress Point Way
- 1109 Cypress Point Way Unit 103
- 1121 Cypress Point Way Unit 106
- 1105 Cypress Point Way
- 1101 Cypress Point Way Unit 101
- 1125 Cypress Point Way Unit 107
- 1129 Cypress Point Way Unit 108
- 1140 Cypress Point Way
- 1133 Cypress Point Way
- 1141 Cypress Point Way
- 1137 Cypress Point Way
- 1156 Cypress Point Way
- 1144 Cypress Point Way
- 1145 Cypress Point Way
- 1148 Cypress Point Way
- 1149 Cypress Point Way
- 1160 Cypress Point Way
- 1161 Cypress Point Way
- 1153 Cypress Point Way
- 1153 Cypress Point Way Unit 105