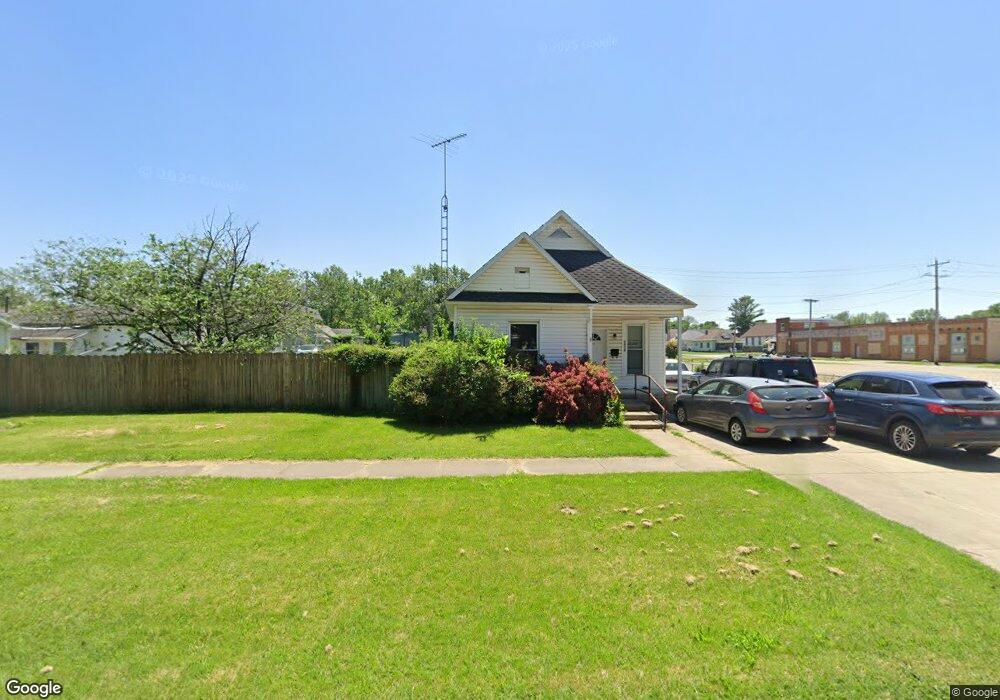
1113 Dewitt Ave Mattoon, IL 61938
Estimated Value: $56,206 - $68,000
2
Beds
1
Bath
770
Sq Ft
$82/Sq Ft
Est. Value
About This Home
This home is located at 1113 Dewitt Ave, Mattoon, IL 61938 and is currently estimated at $63,052, approximately $81 per square foot. 1113 Dewitt Ave is a home located in Coles County with nearby schools including Mattoon High School, St Mary School, and St. John's Lutheran School.
Ownership History
Date
Name
Owned For
Owner Type
Purchase Details
Closed on
Aug 4, 2021
Sold by
Weck Jerry C
Bought by
Trusteeservices Usa Com Llc and The Dewitt Family Revocable Trust
Current Estimated Value
Purchase Details
Closed on
Aug 8, 2013
Sold by
Bushur Tom A
Bought by
Weck Jerry C and Weck Carolyn S
Purchase Details
Closed on
Oct 31, 2012
Sold by
Bushur Gracie
Bought by
Bushur Tom A
Purchase Details
Closed on
Oct 8, 2008
Sold by
Bushur Levi A and Bushur Erin N
Bought by
Bushur Gracie
Home Financials for this Owner
Home Financials are based on the most recent Mortgage that was taken out on this home.
Original Mortgage
$25,000
Interest Rate
5.94%
Mortgage Type
New Conventional
Purchase Details
Closed on
Sep 8, 2005
Sold by
Claxon Eunice M and Claxon Darol Dean
Bought by
Bushur Levi A and Smith Erin N
Home Financials for this Owner
Home Financials are based on the most recent Mortgage that was taken out on this home.
Original Mortgage
$37,288
Interest Rate
5.97%
Mortgage Type
Purchase Money Mortgage
Create a Home Valuation Report for This Property
The Home Valuation Report is an in-depth analysis detailing your home's value as well as a comparison with similar homes in the area
Home Values in the Area
Average Home Value in this Area
Purchase History
| Date | Buyer | Sale Price | Title Company |
|---|---|---|---|
| Trusteeservices Usa Com Llc | $17,000 | None Available | |
| Weck Jerry C | $33,000 | None Available | |
| Bushur Tom A | -- | None Available | |
| Bushur Gracie | $50,000 | None Available | |
| Bushur Levi A | $45,000 | None Available |
Source: Public Records
Mortgage History
| Date | Status | Borrower | Loan Amount |
|---|---|---|---|
| Previous Owner | Bushur Gracie | $25,000 | |
| Previous Owner | Bushur Levi A | $37,288 |
Source: Public Records
Tax History
| Year | Tax Paid | Tax Assessment Tax Assessment Total Assessment is a certain percentage of the fair market value that is determined by local assessors to be the total taxable value of land and additions on the property. | Land | Improvement |
|---|---|---|---|---|
| 2024 | $1,253 | $14,745 | $1,388 | $13,357 |
| 2023 | $1,132 | $13,165 | $1,239 | $11,926 |
| 2022 | $1,132 | $12,948 | $1,219 | $11,729 |
| 2021 | $1,135 | $11,893 | $1,120 | $10,773 |
| 2020 | $1,548 | $16,985 | $1,160 | $15,825 |
| 2019 | $1,524 | $16,394 | $3,744 | $12,650 |
| 2018 | $1,497 | $16,394 | $3,744 | $12,650 |
| 2017 | $1,492 | $16,394 | $3,744 | $12,650 |
| 2016 | $1,460 | $16,394 | $3,744 | $12,650 |
| 2015 | $915 | $16,394 | $3,744 | $12,650 |
| 2014 | $915 | $16,394 | $3,744 | $12,650 |
| 2013 | $915 | $16,394 | $3,744 | $12,650 |
Source: Public Records
Map
Nearby Homes
- 916 Piatt Ave
- 1 Brown Ct
- 1205 Champaign Ave
- 1412 Champaign Ave
- 812 N 8th St Unit 64
- 812 N 8th St Unit 36
- 1612 Richmond Ave
- 421 Dewitt Ave
- 1800 Piatt Ave
- 1401 N 10th St
- 1905 Dewitt Ave
- 304 Dewitt Ave
- 1101 Wabash Ave
- 1001 Wabash Ave
- 1301 Lafayette Ave
- 1312 Edgar Ave
- 1509 Lafayette Ave
- 713 N 23rd St
- 2317 Shelby Ave
- 521 S 17th St
- 1121 Dewitt Ave
- 1101 Dewitt Ave
- 1112 Moultrie Ave
- 1108 Moultrie Ave
- 1105 Dewitt Ave Unit 1101
- 1100 Moultrie Ave
- 1112 Dewitt Ave
- 1104 Moultrie Ave
- 1116 Dewitt Ave
- 1108 Dewitt Ave
- 1100 Dewitt Ave
- 1120 Dewitt Ave
- 1104 Dewitt Ave
- 1201 Dewitt Ave
- 1020 Moultrie Ave
- 1021 Dewitt Ave
- 712 N 12th St
- 709 N 12th St
- 1016 Moultrie Ave
- 1213 Dewitt Ave
Your Personal Tour Guide
Ask me questions while you tour the home.