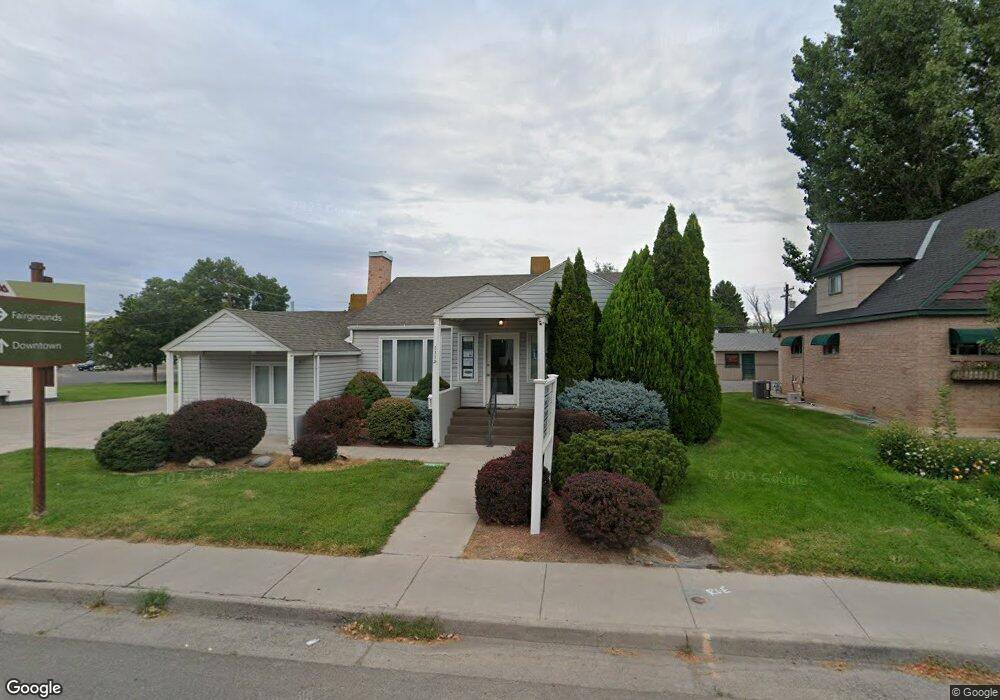
1113 E Main St Montrose, CO 81401
Estimated Value: $485,117
Studio
3
Baths
2,385
Sq Ft
$203/Sq Ft
Est. Value
About This Home
This home is located at 1113 E Main St, Montrose, CO 81401 and is currently estimated at $485,117, approximately $203 per square foot. 1113 E Main St is a home located in Montrose County with nearby schools including Johnson Elementary School, Centennial Middle School, and Montrose High School.
Ownership History
Date
Name
Owned For
Owner Type
Purchase Details
Closed on
Sep 25, 2023
Sold by
Evening Star Properties Llc
Bought by
Cooper Paul A
Current Estimated Value
Purchase Details
Closed on
Aug 30, 2004
Sold by
Kienholz M David
Bought by
Evening Star Properties Llc
Purchase Details
Closed on
Dec 31, 1991
Sold by
Miller James E and Miller David Kienholz
Bought by
Kienholz M David
Purchase Details
Closed on
Nov 7, 1988
Sold by
East Lloyd L
Bought by
Miller James E and Miller David Kienholz
Purchase Details
Closed on
Sep 30, 1988
Sold by
Anderson Herbert C Pt
Bought by
East Lloyd L
Purchase Details
Closed on
Feb 14, 1984
Sold by
East Lloyd L & East Helen
Bought by
Ames George H and Ames Shirley M
Purchase Details
Closed on
Oct 1, 1980
Sold by
Dantzman Joe
Bought by
East Lloyd L & East Helen
Purchase Details
Closed on
Feb 28, 1978
Sold by
Calhoun Jarold W and Calhoun Dorothy E
Bought by
Dantzman Joe
Create a Home Valuation Report for This Property
The Home Valuation Report is an in-depth analysis detailing your home's value as well as a comparison with similar homes in the area
Purchase History
| Date | Buyer | Sale Price | Title Company |
|---|---|---|---|
| Cooper Paul A | $462,000 | None Listed On Document | |
| Evening Star Properties Llc | $315,000 | -- | |
| Kienholz M David | $25,000 | -- | |
| Miller James E | $69,200 | -- | |
| East Lloyd L | -- | -- | |
| Ames George H | $85,000 | -- | |
| East Lloyd L & East Helen | $79,000 | -- | |
| Dantzman Joe | $46,000 | -- |
Source: Public Records
Tax History
| Year | Tax Paid | Tax Assessment Tax Assessment Total Assessment is a certain percentage of the fair market value that is determined by local assessors to be the total taxable value of land and additions on the property. | Land | Improvement |
|---|---|---|---|---|
| 2025 | $12,376 | $356,280 | $178,140 | $178,140 |
| 2024 | $10,950 | $153,790 | $36,170 | $117,620 |
| 2023 | $10,464 | $168,540 | $37,590 | $130,950 |
| 2022 | $8,696 | $126,370 | $31,320 | $95,050 |
| 2021 | $8,712 | $126,370 | $31,320 | $95,050 |
| 2020 | $7,951 | $118,500 | $29,000 | $89,500 |
| 2019 | $8,003 | $118,500 | $29,000 | $89,500 |
| 2018 | $7,301 | $98,360 | $27,550 | $70,810 |
| 2017 | $7,246 | $98,360 | $27,550 | $70,810 |
| 2016 | $7,467 | $102,950 | $27,550 | $75,400 |
| 2014 | $6,929 | $103,430 | $29,000 | $74,430 |
Source: Public Records
Map
Nearby Homes
- 1136 N 1st St
- 1124 N 1st St
- 1037 N 1st St
- 1033 S 2nd St
- 1146 S 2nd St
- 218 N Stough Ave
- 839 N 1st St
- 741 S 1st St
- 301 Colonial Ct
- 707 N 1st St
- 1416 Colonial Dr
- 746 S 2nd St
- 715 S 2nd St
- 1018 S 5th St Unit 7
- 920 S 5th St
- 701 N 4th St
- 383 S Hillcrest Dr Unit 62
- 383 S Hillcrest Dr Unit 91
- 383 S Hillcrest Dr Unit 49
- 383 S Hillcrest Dr Unit 30
- 1151 E Main St
- 1191 E Main St
- 1135 E Main St
- 1116 N 1st St
- 1106 N 1st St
- 1100 E Main St Unit A & B
- 1100 E Main St Unit C
- 1100 N 1st St
- 1120 E Main St
- 1136 E Main St
- 1144 E Main St
- S Stough Ave
- 21 S Pythian Ave
- S Pythian St
- 30 N Stough Ave
- 1046 E Main St
- 1119 S 1st St
- 1127 S 1st St
- 1105 S 1st St
- 1200 N 1st St
Your Personal Tour Guide
Ask me questions while you tour the home.