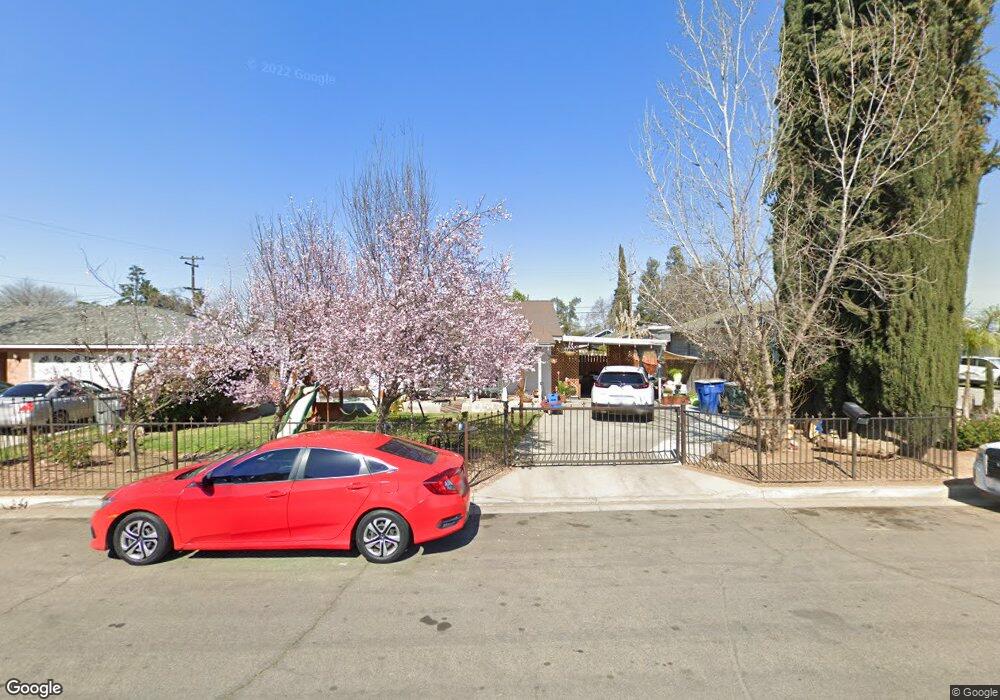
1113 E Pontiac Way Fresno, CA 93704
Maroa NeighborhoodEstimated Value: $308,000 - $355,000
3
Beds
2
Baths
1,362
Sq Ft
$243/Sq Ft
Est. Value
About This Home
This home is located at 1113 E Pontiac Way, Fresno, CA 93704 and is currently estimated at $330,320, approximately $242 per square foot. 1113 E Pontiac Way is a home located in Fresno County with nearby schools including Del Mar Elementary School, Fort Miller Middle School, and Fresno High School.
Ownership History
Date
Name
Owned For
Owner Type
Purchase Details
Closed on
Dec 22, 2000
Sold by
Kochergen Enterprises
Bought by
Molina Cathy Irene
Current Estimated Value
Home Financials for this Owner
Home Financials are based on the most recent Mortgage that was taken out on this home.
Original Mortgage
$78,271
Outstanding Balance
$28,241
Interest Rate
7.41%
Mortgage Type
FHA
Estimated Equity
$302,079
Purchase Details
Closed on
Dec 17, 1996
Sold by
Haning Michael M and Haning Linda
Bought by
Kochergen Enterprises Family Lp
Purchase Details
Closed on
Oct 10, 1996
Sold by
Desiga Elizabeth and Haning Michael M
Bought by
Haning Michael M and Haning Linda
Create a Home Valuation Report for This Property
The Home Valuation Report is an in-depth analysis detailing your home's value as well as a comparison with similar homes in the area
Home Values in the Area
Average Home Value in this Area
Purchase History
| Date | Buyer | Sale Price | Title Company |
|---|---|---|---|
| Molina Cathy Irene | $79,500 | Financial Title Company | |
| Kochergen Enterprises Family Lp | -- | Chicago Title Co | |
| Haning Michael M | $18,143 | American Title Ins Co |
Source: Public Records
Mortgage History
| Date | Status | Borrower | Loan Amount |
|---|---|---|---|
| Open | Molina Cathy Irene | $78,271 | |
| Closed | Molina Cathy Irene | $2,385 |
Source: Public Records
Tax History Compared to Growth
Tax History
| Year | Tax Paid | Tax Assessment Tax Assessment Total Assessment is a certain percentage of the fair market value that is determined by local assessors to be the total taxable value of land and additions on the property. | Land | Improvement |
|---|---|---|---|---|
| 2025 | $1,676 | $127,195 | $45,191 | $82,004 |
| 2023 | $1,583 | $122,258 | $43,437 | $78,821 |
| 2022 | $1,472 | $112,862 | $42,586 | $70,276 |
| 2021 | $1,433 | $110,650 | $41,751 | $68,899 |
| 2020 | $1,426 | $109,516 | $41,323 | $68,193 |
| 2019 | $1,372 | $107,369 | $40,513 | $66,856 |
| 2018 | $1,343 | $105,265 | $39,719 | $65,546 |
| 2017 | $1,320 | $103,202 | $38,941 | $64,261 |
| 2016 | $1,277 | $101,179 | $38,178 | $63,001 |
| 2015 | $1,258 | $99,660 | $37,605 | $62,055 |
| 2014 | $1,233 | $97,709 | $36,869 | $60,840 |
Source: Public Records
Map
Nearby Homes
- 1212 E Saginaw Way
- 1020 E Saginaw Way
- 1135 E Lansing Way
- 1403 E Griffith Way
- 1406 E Hampton Way
- 4012 N Wishon Ave
- 4266 N College Ave
- 625 E Lansing Way
- 935 E Fedora Ave
- 1305 E Fedora Ave
- 3606 N College Ave
- 4355 N College Ave
- 1408 E Richert Ave
- 1911 E Saginaw Way
- 4175 N Van Ness Blvd
- 1405 E Cortland Ave
- 3640 N Van Ness Blvd
- 3734 N Abby St
- 2108 E Sussex Way
- 4121 N Palm Ave
- 1101 E Pontiac Way
- 1133 E Pontiac Way
- 1116 E Griffith Way
- 1106 E Griffith Way
- 1126 E Griffith Way
- 1149 E Pontiac Way
- 1136 E Griffith Way
- 1114 E Pontiac Way
- 1124 E Pontiac Way
- 1102 E Pontiac Way
- 3967 N College Ave
- 3959 N College Ave
- 3983 N College Ave
- 1146 E Griffith Way
- 1126 E Pontiac Way
- 1209 E Pontiac Way
- 1148 E Pontiac Way
- 1038 E Pontiac Way
- 1034 E Griffith Way
- 1204 E Griffith Way