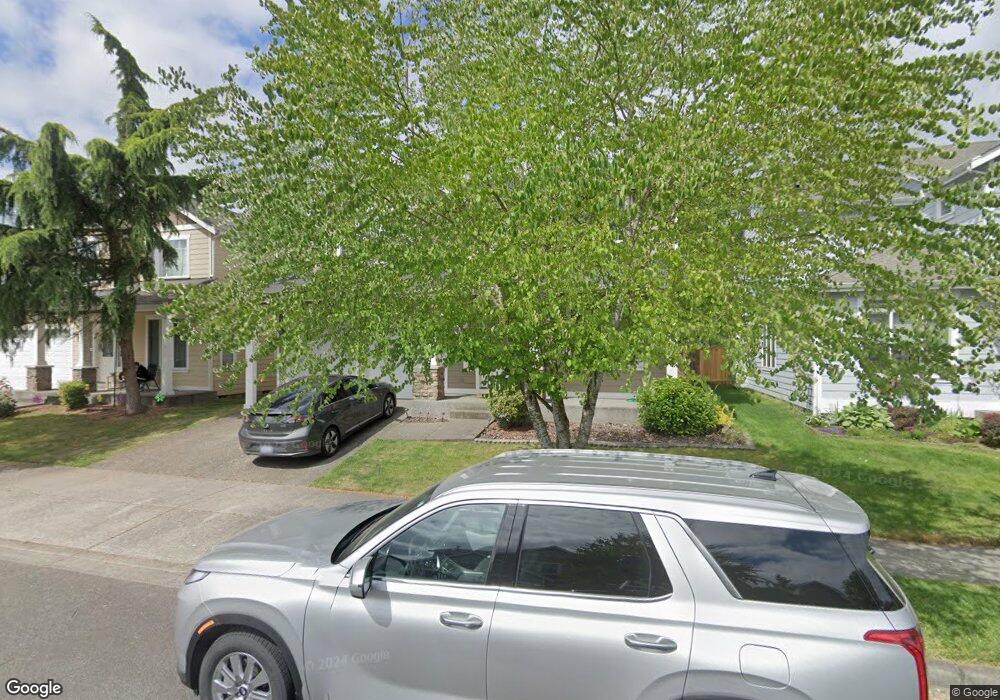
1113 Eagle Ave SW Orting, WA 98360
Estimated Value: $568,544 - $610,000
5
Beds
3
Baths
2,844
Sq Ft
$205/Sq Ft
Est. Value
About This Home
This home is located at 1113 Eagle Ave SW, Orting, WA 98360 and is currently estimated at $581,636, approximately $204 per square foot. 1113 Eagle Ave SW is a home located in Pierce County with nearby schools including Orting Elementary School, Ptarmigan Ridge Elementary School, and Orting Middle School.
Ownership History
Date
Name
Owned For
Owner Type
Purchase Details
Closed on
Jun 28, 2018
Sold by
2018 3 Ih Borrower Lp
Bought by
2018 3 Ih Borrower Lp
Current Estimated Value
Home Financials for this Owner
Home Financials are based on the most recent Mortgage that was taken out on this home.
Original Mortgage
$130,038,300
Outstanding Balance
$112,697,607
Interest Rate
4.5%
Mortgage Type
Loan Amount Between One & Nine Billion
Estimated Equity
-$112,115,971
Purchase Details
Closed on
Jun 19, 2015
Sold by
Ih2 Property Washington Lp
Bought by
2015-3 Ih2 Borrower Lp
Home Financials for this Owner
Home Financials are based on the most recent Mortgage that was taken out on this home.
Original Mortgage
$119,395,000
Interest Rate
3.85%
Mortgage Type
Loan Amount Between One & Nine Billion
Purchase Details
Closed on
May 8, 2013
Sold by
Leaman Timothy D and Leaman Darcy M
Bought by
Ih2 Property Washington Lp
Purchase Details
Closed on
Jan 8, 2007
Sold by
Rl Holdings Llc
Bought by
Leaman Timothy D and Leaman Darcy M
Home Financials for this Owner
Home Financials are based on the most recent Mortgage that was taken out on this home.
Original Mortgage
$265,600
Interest Rate
8.58%
Mortgage Type
Negative Amortization
Create a Home Valuation Report for This Property
The Home Valuation Report is an in-depth analysis detailing your home's value as well as a comparison with similar homes in the area
Home Values in the Area
Average Home Value in this Area
Purchase History
| Date | Buyer | Sale Price | Title Company |
|---|---|---|---|
| 2018 3 Ih Borrower Lp | -- | None Available | |
| 2015-3 Ih2 Borrower Lp | -- | Fidelity Natl Title Group | |
| Ih2 Property Washington Lp | $239,000 | Fidelity National Title | |
| Leaman Timothy D | -- | First American Title Ins Co |
Source: Public Records
Mortgage History
| Date | Status | Borrower | Loan Amount |
|---|---|---|---|
| Open | 2018 3 Ih Borrower Lp | $130,038,300 | |
| Closed | 2015-3 Ih2 Borrower Lp | $119,395,000 | |
| Previous Owner | Leaman Timothy D | $265,600 |
Source: Public Records
Tax History
| Year | Tax Paid | Tax Assessment Tax Assessment Total Assessment is a certain percentage of the fair market value that is determined by local assessors to be the total taxable value of land and additions on the property. | Land | Improvement |
|---|---|---|---|---|
| 2025 | $4,579 | $564,200 | $176,700 | $387,500 |
| 2024 | $4,579 | $555,300 | $176,700 | $378,600 |
| 2023 | $4,579 | $490,600 | $169,600 | $321,000 |
| 2022 | $4,420 | $515,800 | $169,600 | $346,200 |
| 2021 | $4,688 | $387,500 | $100,800 | $286,700 |
| 2019 | $4,151 | $351,700 | $85,500 | $266,200 |
| 2018 | $4,314 | $322,300 | $74,500 | $247,800 |
| 2017 | $3,960 | $286,300 | $59,800 | $226,500 |
| 2016 | $4,039 | $260,000 | $45,300 | $214,700 |
| 2014 | $3,404 | $241,300 | $40,500 | $200,800 |
| 2013 | $3,404 | $201,500 | $31,800 | $169,700 |
Source: Public Records
Map
Nearby Homes
- 907 Orting Kapowsin Hwy E
- 714 Teetor Cir NW Unit LOT 7
- 705 Teetor Cir NW Unit Lot 27
- 707 Teetor Cir NW Unit Lot 26
- 702 Teetor Cir NW Unit LOT 1
- 704 Teetor NW Unit LOT 2
- 706 Teetor Cir NW Unit LOT 3
- 717 Teetor Cir NW Unit Lot 21
- 728 Teetor Cir NW Unit Lot 30
- 708 Teetor Cir NW Unit LOT 4
- 710 Teetor Cir NW
- 710 Teetor Cir NW Unit LOT 5
- 721 Teetor Cir NW Unit Lot 19
- 721 Teetor Cir NW
- 723 Teetor Cir NW Unit LOT 18
- 732 Teetor Cir NW Unit Lot 32
- 725 Teetor Cir NW Unit Lot 17
- 734 Teetor Cir NW Unit Lot 33
- 716 Teetor Cir NW Unit Lot 08
- 727 Teetor Cir NW Unit Lot 16
- 1111 Eagle Ave SW
- 1115 Eagle Ave SW
- 1117 Eagle Ave SW
- 1109 Eagle Ave SW
- 1112 Eagle Ave SW
- 1107 Eagle Ave SW
- 1114 Eagle Ave SW
- 1119 Eagle Ave SW
- 1110 Eagle Ave SW
- 1108 Eagle Ave SW
- 1118 Eagle Ave SW
- 1103 Eagle Ave SW
- 103 Robin St SW
- 101 Robin St SW
- 1104 Eagle Ave SW
- 105 Robin St SW
- 1101 Eagle Ave SW
- 1102 Eagle Ave SW
Your Personal Tour Guide
Ask me questions while you tour the home.