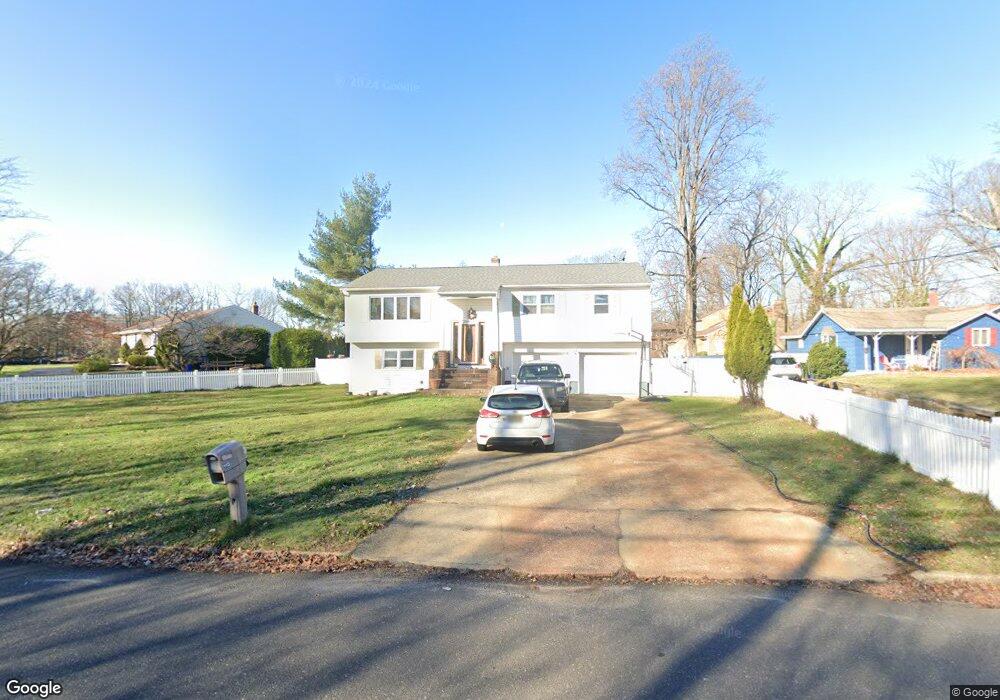
1113 Logan Rd Ocean, NJ 07712
Wanamassa NeighborhoodEstimated Value: $669,000 - $971,868
3
Beds
2
Baths
2,106
Sq Ft
$390/Sq Ft
Est. Value
About This Home
This home is located at 1113 Logan Rd, Ocean, NJ 07712 and is currently estimated at $821,967, approximately $390 per square foot. 1113 Logan Rd is a home located in Monmouth County with nearby schools including Ocean Township High School, St. Mary of the Assumption School, and Our Lady of Mount Carmel School.
Ownership History
Date
Name
Owned For
Owner Type
Purchase Details
Closed on
Oct 24, 2023
Sold by
Ganley Rachel I and Ganley William
Bought by
Ganley Rachel I
Current Estimated Value
Purchase Details
Closed on
Sep 13, 2017
Sold by
Ganley Rachel I
Bought by
Ganley Rachel I and Ganley William
Home Financials for this Owner
Home Financials are based on the most recent Mortgage that was taken out on this home.
Original Mortgage
$316,800
Interest Rate
3.78%
Mortgage Type
New Conventional
Purchase Details
Closed on
Oct 2, 2012
Sold by
Wells Fargo Bank Na
Bought by
Koeppel Rachel
Home Financials for this Owner
Home Financials are based on the most recent Mortgage that was taken out on this home.
Original Mortgage
$274,928
Interest Rate
3.25%
Mortgage Type
FHA
Purchase Details
Closed on
Dec 6, 2011
Sold by
Feeney Stella M
Bought by
Wells Fargo Bank N A
Create a Home Valuation Report for This Property
The Home Valuation Report is an in-depth analysis detailing your home's value as well as a comparison with similar homes in the area
Home Values in the Area
Average Home Value in this Area
Purchase History
| Date | Buyer | Sale Price | Title Company |
|---|---|---|---|
| Ganley Rachel I | $50,000 | All Ahead Title | |
| Ganley Rachel I | $50,000 | All Ahead Title | |
| Ganley Rachel I | -- | All Ahead Title Agency | |
| Koeppel Rachel | $280,000 | Agent For Fidelity National | |
| Wells Fargo Bank N A | $410,810 | Rels Centralized Title |
Source: Public Records
Mortgage History
| Date | Status | Borrower | Loan Amount |
|---|---|---|---|
| Previous Owner | Ganley Rachel I | $316,800 | |
| Previous Owner | Koeppel Rachel | $274,928 |
Source: Public Records
Tax History
| Year | Tax Paid | Tax Assessment Tax Assessment Total Assessment is a certain percentage of the fair market value that is determined by local assessors to be the total taxable value of land and additions on the property. | Land | Improvement |
|---|---|---|---|---|
| 2025 | $11,596 | $850,300 | $607,200 | $243,100 |
| 2024 | $9,457 | $798,100 | $560,500 | $237,600 |
| 2023 | $9,457 | $607,400 | $376,400 | $231,000 |
| 2022 | $8,915 | $524,300 | $304,400 | $219,900 |
| 2021 | $8,915 | $445,100 | $250,300 | $194,800 |
| 2020 | $8,759 | $431,700 | $241,300 | $190,400 |
| 2019 | $8,518 | $410,300 | $221,000 | $189,300 |
| 2018 | $8,468 | $397,000 | $216,500 | $180,500 |
| 2017 | $7,999 | $373,600 | $203,000 | $170,600 |
| 2016 | $7,165 | $300,800 | $176,000 | $124,800 |
| 2015 | $7,248 | $308,300 | $176,000 | $132,300 |
| 2014 | $7,314 | $315,800 | $203,000 | $112,800 |
Source: Public Records
Map
Nearby Homes
- 4 Keleigh Place
- 3104 Sunset Ave
- 308 Lincoln Dr
- 1124 Jeffrey Ave
- 1303 Laurel Ave
- 1125 Interlaken Ave
- 1703 Drummond Ct
- 611 Bingham St
- 126 Leonard Ave
- 601 New Jersey 35
- 14 Redwood Dr
- 1528 Monroe Ave
- 590 Bingham St
- 1205 Jeffrey St
- 822 Prospect Ave
- 1815 Summerfield Ave
- 830 Dunlewy St
- 1405 Wanamassa Rd
- 1316 Monroe Ave
- 1519 Sewall Ave
Your Personal Tour Guide
Ask me questions while you tour the home.