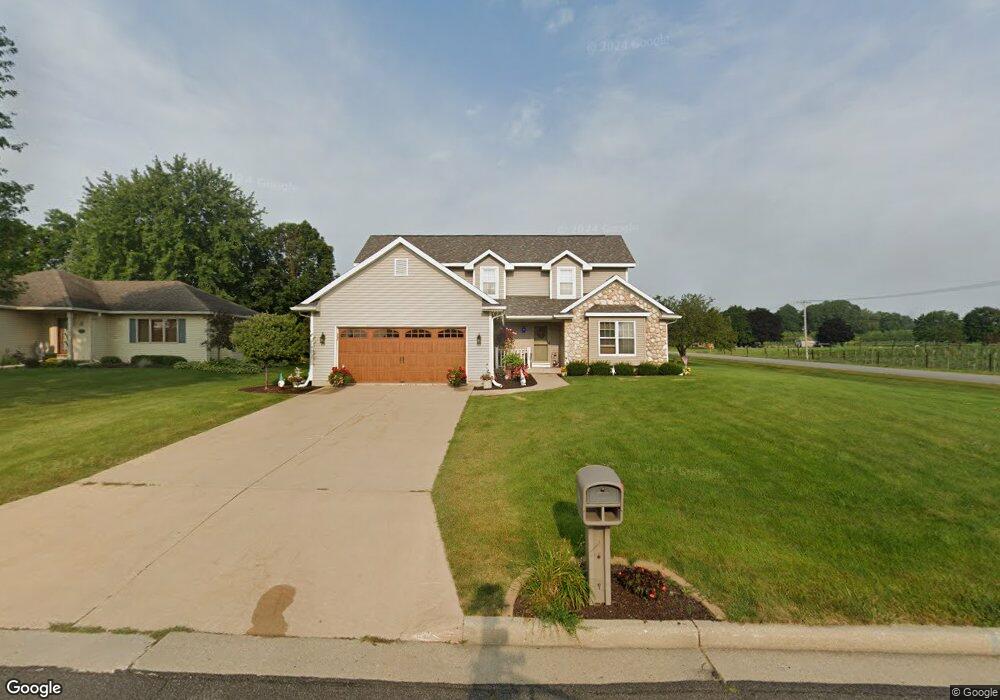
1113 Lum Ave Waterloo, WI 53594
Estimated Value: $393,000 - $472,000
3
Beds
4
Baths
2,857
Sq Ft
$153/Sq Ft
Est. Value
About This Home
This home is located at 1113 Lum Ave, Waterloo, WI 53594 and is currently estimated at $437,599, approximately $153 per square foot. 1113 Lum Ave is a home located in Jefferson County with nearby schools including Waterloo Elementary School, Waterloo Middle School, and Waterloo Intermediate School.
Ownership History
Date
Name
Owned For
Owner Type
Purchase Details
Closed on
Dec 19, 2014
Sold by
Ellis Alois R and Ellis Tammy R
Bought by
Zwieg Katherine L
Current Estimated Value
Home Financials for this Owner
Home Financials are based on the most recent Mortgage that was taken out on this home.
Original Mortgage
$184,800
Outstanding Balance
$139,860
Interest Rate
3.99%
Mortgage Type
New Conventional
Estimated Equity
$297,739
Purchase Details
Closed on
Jul 10, 2006
Sold by
Ellis Alois R and Ellis Tammy R
Bought by
Ellis Alois R and Ellis Tammy R
Purchase Details
Closed on
Nov 15, 2005
Sold by
Stronach David G and Stronach Stephanni P
Bought by
Ellis Alois R and Ellis Tammy R
Home Financials for this Owner
Home Financials are based on the most recent Mortgage that was taken out on this home.
Original Mortgage
$53,000
Interest Rate
6.04%
Mortgage Type
New Conventional
Create a Home Valuation Report for This Property
The Home Valuation Report is an in-depth analysis detailing your home's value as well as a comparison with similar homes in the area
Home Values in the Area
Average Home Value in this Area
Purchase History
| Date | Buyer | Sale Price | Title Company |
|---|---|---|---|
| Zwieg Katherine L | $231,000 | None Available | |
| Ellis Alois R | -- | None Available | |
| Ellis Alois R | $226,000 | Title Consultants Inc |
Source: Public Records
Mortgage History
| Date | Status | Borrower | Loan Amount |
|---|---|---|---|
| Open | Zwieg Katherine L | $184,800 | |
| Previous Owner | Ellis Alois R | $53,000 |
Source: Public Records
Tax History
| Year | Tax Paid | Tax Assessment Tax Assessment Total Assessment is a certain percentage of the fair market value that is determined by local assessors to be the total taxable value of land and additions on the property. | Land | Improvement |
|---|---|---|---|---|
| 2024 | $6,389 | $395,300 | $55,500 | $339,800 |
| 2023 | $6,293 | $324,100 | $45,000 | $279,100 |
| 2022 | $5,648 | $307,000 | $45,000 | $262,000 |
| 2021 | $5,722 | $307,000 | $45,000 | $262,000 |
| 2020 | $5,823 | $238,500 | $33,100 | $205,400 |
| 2019 | $5,831 | $238,500 | $33,100 | $205,400 |
| 2018 | $5,742 | $238,500 | $33,100 | $205,400 |
| 2017 | $5,572 | $238,500 | $33,100 | $205,400 |
| 2016 | $5,556 | $238,500 | $33,100 | $205,400 |
| 2015 | $5,802 | $238,500 | $33,100 | $205,400 |
| 2014 | $5,329 | $224,300 | $33,100 | $191,200 |
| 2013 | $5,286 | $224,300 | $33,100 | $191,200 |
Source: Public Records
Map
Nearby Homes
- 291 Goehl Rd
- 915 Lum Ave
- 1035 Bluegrass Trail
- 1003 N Monroe St
- 225 Anna St
- 902 Anna Ct
- 820 Anna Ct
- Outlots 65 & 66 Portland Rd
- 318 E Madison St
- 355 W Madison St Unit 2
- 613 Mohawk Ct
- 422 W Madison St
- 311 Harrison St
- 407 S Jackson St
- 0 Peschel St
- Lt1 W Madison St
- 694 Fox Ln
- 80 M L Acres Jordan Rd
- 206 Canal Rd
- 1.09 ACRE Dalman Rd
Your Personal Tour Guide
Ask me questions while you tour the home.