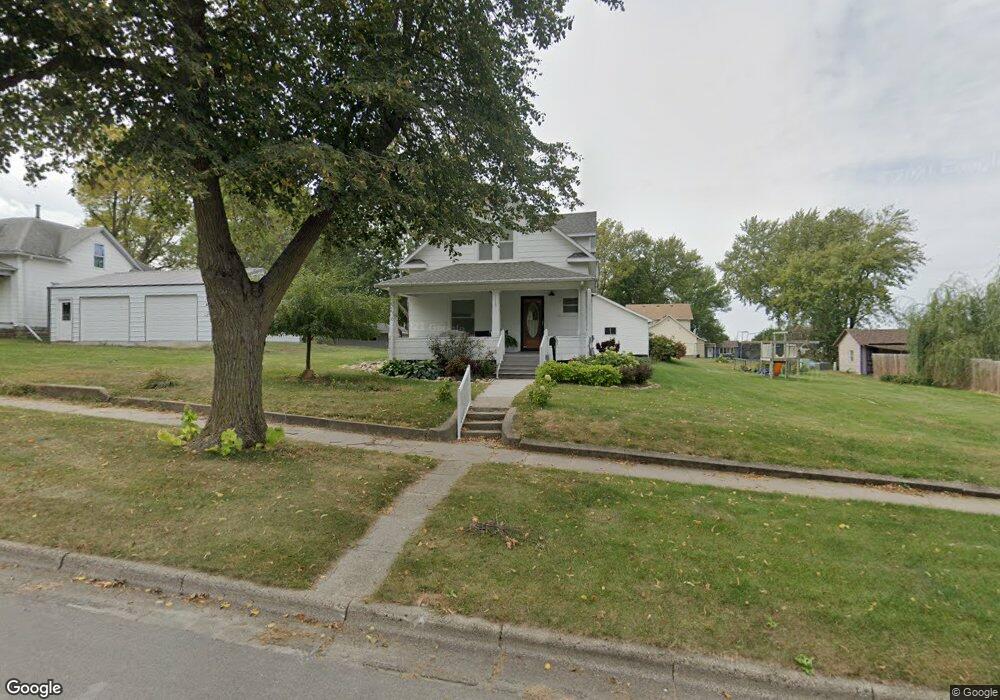
1113 Main St Manning, IA 51455
Estimated Value: $137,000 - $204,000
4
Beds
2
Baths
1,352
Sq Ft
$117/Sq Ft
Est. Value
About This Home
This home is located at 1113 Main St, Manning, IA 51455 and is currently estimated at $158,363, approximately $117 per square foot. 1113 Main St is a home with nearby schools including Ikm-Manning High School, IKM-Manning Middle School, and Irwin Elementary School.
Ownership History
Date
Name
Owned For
Owner Type
Purchase Details
Closed on
May 31, 2022
Sold by
Neumann Colton R and Neumann Anna M
Bought by
Neumann Colton R and Neumann Anna M
Current Estimated Value
Purchase Details
Closed on
Aug 23, 2018
Sold by
Weitl Shona J and Weitl Bill
Bought by
Irlbeck Anna M
Home Financials for this Owner
Home Financials are based on the most recent Mortgage that was taken out on this home.
Original Mortgage
$85,000
Interest Rate
4.5%
Mortgage Type
New Conventional
Purchase Details
Closed on
Jul 16, 2013
Sold by
Hagedorn Deanna
Bought by
Weitl Shona J and Barsby Shelli D
Create a Home Valuation Report for This Property
The Home Valuation Report is an in-depth analysis detailing your home's value as well as a comparison with similar homes in the area
Home Values in the Area
Average Home Value in this Area
Purchase History
| Date | Buyer | Sale Price | Title Company |
|---|---|---|---|
| Neumann Colton R | -- | None Listed On Document | |
| Irlbeck Anna M | $85,000 | -- | |
| Weitl Shona J | -- | None Available |
Source: Public Records
Mortgage History
| Date | Status | Borrower | Loan Amount |
|---|---|---|---|
| Previous Owner | Irlbeck Anna M | $85,000 |
Source: Public Records
Tax History Compared to Growth
Tax History
| Year | Tax Paid | Tax Assessment Tax Assessment Total Assessment is a certain percentage of the fair market value that is determined by local assessors to be the total taxable value of land and additions on the property. | Land | Improvement |
|---|---|---|---|---|
| 2025 | $1,294 | $116,960 | $17,860 | $99,100 |
| 2024 | $1,230 | $98,160 | $17,860 | $80,300 |
| 2023 | $1,070 | $98,160 | $17,860 | $80,300 |
| 2022 | $1,052 | $72,950 | $12,690 | $60,260 |
| 2021 | $1,052 | $72,950 | $12,690 | $60,260 |
| 2020 | $1,074 | $72,950 | $12,690 | $60,260 |
| 2019 | $916 | $72,950 | $12,690 | $60,260 |
| 2018 | $876 | $52,790 | $0 | $0 |
| 2017 | $848 | $52,794 | $9,962 | $42,832 |
| 2016 | $820 | $49,340 | $0 | $0 |
| 2015 | $820 | $45,590 | $0 | $0 |
| 2014 | $762 | $45,590 | $0 | $0 |
Source: Public Records
Map
Nearby Homes