Estimated Value: $134,354 - $149,000
2
Beds
1
Bath
952
Sq Ft
$148/Sq Ft
Est. Value
About This Home
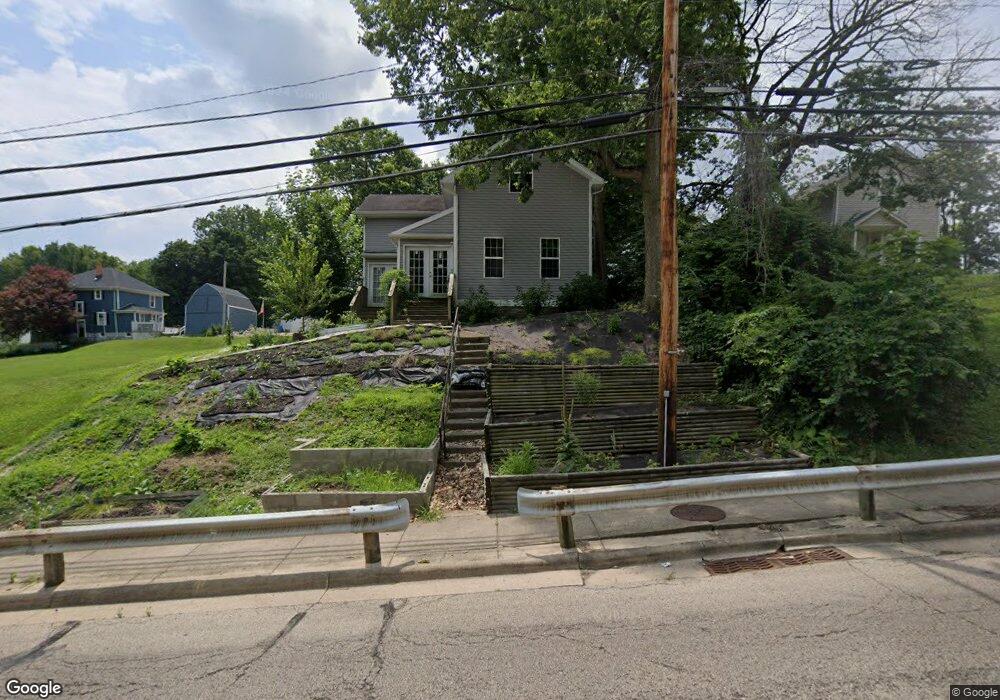
This home is located at 1113 W High St, Piqua, OH 45356 and is currently estimated at $141,339, approximately $148 per square foot. 1113 W High St is a home located in Miami County with nearby schools including Washington Primary School, Piqua Junior High School, and Piqua High School.
Ownership History
Date
Name
Owned For
Owner Type
Purchase Details
Closed on
Apr 3, 2018
Sold by
Acm Vision V Llc
Bought by
Avail 1 Llc
Current Estimated Value
Purchase Details
Closed on
Nov 25, 2013
Sold by
Mom Haven 13 Lp
Bought by
Acm Vision V Llc
Purchase Details
Closed on
Jun 28, 2011
Sold by
The Bank Of New York Mellon
Bought by
Mom Haven 13 Lp
Purchase Details
Closed on
Feb 23, 2011
Sold by
Klingler Keith J
Bought by
The Bank Of New York Mellon
Purchase Details
Closed on
Sep 1, 1979
Bought by
Klingler Keith J
Create a Home Valuation Report for This Property
The Home Valuation Report is an in-depth analysis detailing your home's value as well as a comparison with similar homes in the area
Home Values in the Area
Average Home Value in this Area
Purchase History
| Date | Buyer | Sale Price | Title Company |
|---|---|---|---|
| Avail 1 Llc | $28,000 | None Listed On Document | |
| Acm Vision V Llc | -- | None Available | |
| Mom Haven 13 Lp | $6,500 | -- | |
| The Bank Of New York Mellon | $30,000 | -- | |
| Klingler Keith J | $10,000 | -- |
Source: Public Records
Tax History Compared to Growth
Tax History
| Year | Tax Paid | Tax Assessment Tax Assessment Total Assessment is a certain percentage of the fair market value that is determined by local assessors to be the total taxable value of land and additions on the property. | Land | Improvement |
|---|---|---|---|---|
| 2024 | $1,047 | $24,820 | $7,840 | $16,980 |
| 2023 | $1,047 | $24,820 | $7,840 | $16,980 |
| 2022 | $1,065 | $24,820 | $7,840 | $16,980 |
| 2021 | $892 | $19,080 | $6,020 | $13,060 |
| 2020 | $877 | $19,080 | $6,020 | $13,060 |
| 2019 | $882 | $19,080 | $6,020 | $13,060 |
| 2018 | $922 | $19,010 | $6,060 | $12,950 |
| 2017 | $777 | $15,830 | $6,060 | $9,770 |
| 2016 | $689 | $14,180 | $6,060 | $8,120 |
| 2015 | $677 | $13,620 | $5,810 | $7,810 |
| 2014 | $677 | $13,620 | $5,810 | $7,810 |
| 2013 | $679 | $13,620 | $5,810 | $7,810 |
Source: Public Records
Map
Nearby Homes
- 1121 W High St
- 1118 W Water St
- 1120 W Water St
- 1116 W Water St
- 1122 W Water St
- 1126 W Water St
- 224 Jackson St
- 1128 W Water St
- 1135 W High St
- 1101 W High St
- 1134 W High St
- 1115 W Water St
- 1109 W Water St
- 1121 W Water St
- 1125 W Water St
- 1105 W Water St
- 225 Jackson St
- 1203 W High St
- 1101 W Water St
- 1129 W Water St