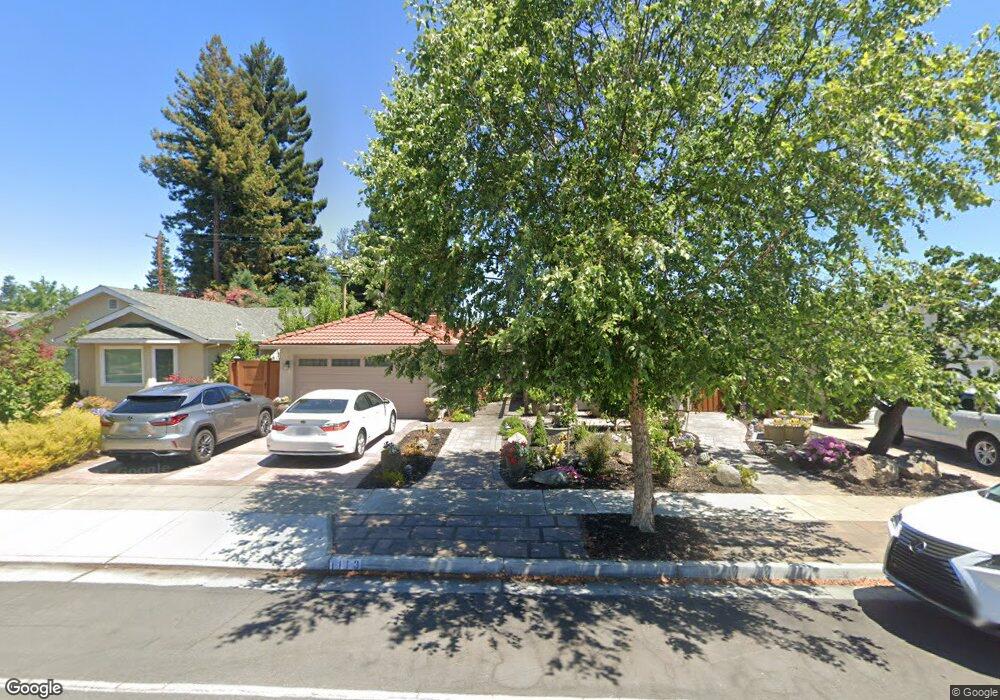
1113 W Knickerbocker Dr Sunnyvale, CA 94087
Estimated Value: $2,623,000 - $3,055,000
3
Beds
2
Baths
1,814
Sq Ft
$1,540/Sq Ft
Est. Value
About This Home
This home is located at 1113 W Knickerbocker Dr, Sunnyvale, CA 94087 and is currently estimated at $2,794,297, approximately $1,540 per square foot. 1113 W Knickerbocker Dr is a home located in Santa Clara County with nearby schools including Cherry Chase Elementary School, Sunnyvale Middle School, and Homestead High School.
Ownership History
Date
Name
Owned For
Owner Type
Purchase Details
Closed on
Jan 25, 2002
Sold by
Buonanno Mark A and Buonanno Nobuko T
Bought by
Buonanno Mark A and Buonanno Nobuko T
Current Estimated Value
Home Financials for this Owner
Home Financials are based on the most recent Mortgage that was taken out on this home.
Original Mortgage
$268,300
Outstanding Balance
$111,801
Interest Rate
7.17%
Estimated Equity
$2,682,496
Purchase Details
Closed on
Oct 24, 1995
Sold by
Spingarn Raymond and Spingarn Survivors Trust
Bought by
Buonanno Mark A and Buonanna Nobuko T
Home Financials for this Owner
Home Financials are based on the most recent Mortgage that was taken out on this home.
Original Mortgage
$276,000
Interest Rate
7.25%
Mortgage Type
Assumption
Purchase Details
Closed on
Apr 17, 1995
Sold by
Spingarn Raymond and Spingarn Family Bypass Trust
Bought by
Spingarn Raymond
Create a Home Valuation Report for This Property
The Home Valuation Report is an in-depth analysis detailing your home's value as well as a comparison with similar homes in the area
Purchase History
| Date | Buyer | Sale Price | Title Company |
|---|---|---|---|
| Buonanno Mark A | -- | American Title Co | |
| Buonanno Mark A | $345,000 | Santa Clara Land Title Co | |
| Spingarn Raymond | -- | -- |
Source: Public Records
Mortgage History
| Date | Status | Borrower | Loan Amount |
|---|---|---|---|
| Open | Buonanno Mark A | $268,300 | |
| Closed | Buonanno Mark A | $276,000 | |
| Closed | Buonanno Mark A | $225,000 |
Source: Public Records
Tax History
| Year | Tax Paid | Tax Assessment Tax Assessment Total Assessment is a certain percentage of the fair market value that is determined by local assessors to be the total taxable value of land and additions on the property. | Land | Improvement |
|---|---|---|---|---|
| 2025 | $6,686 | $573,113 | $343,871 | $229,242 |
| 2024 | $6,686 | $561,877 | $337,129 | $224,748 |
| 2023 | $6,624 | $550,861 | $330,519 | $220,342 |
| 2022 | $6,515 | $540,061 | $324,039 | $216,022 |
| 2021 | $6,451 | $529,473 | $317,686 | $211,787 |
| 2020 | $6,371 | $524,045 | $314,429 | $209,616 |
| 2019 | $6,230 | $513,770 | $308,264 | $205,506 |
| 2018 | $6,120 | $503,697 | $302,220 | $201,477 |
| 2017 | $6,041 | $493,822 | $296,295 | $197,527 |
| 2016 | $5,804 | $484,140 | $290,486 | $193,654 |
| 2015 | $5,836 | $476,869 | $286,123 | $190,746 |
| 2014 | $5,723 | $467,529 | $280,519 | $187,010 |
Source: Public Records
Map
Nearby Homes
- 841 Maranta Ave
- 749 Lois Ave
- 1204 Blackberry Terrace
- 1033 Crestview Dr Unit 207
- 1225 Blackberry Terrace
- 2784 Doverton Square
- 3352 Villa Robleda Dr
- 3411 Shady Spring Ln
- 745 Reseda Dr
- 1283 Pumpkin Terrace
- 377 S Mary Ave
- 1264 Brookings Ln
- 1096 W Mckinley Ave
- 3371 Beaumont Square
- 2025 Yorkshire Way
- 2733 Winfield Dr
- 1155 W Mc Kinley Ave
- 541 Holthouse Terrace
- 1090 Butte Ct
- 1203 Hollenbeck Ave
- 1109 W Knickerbocker Dr
- 1117 W Knickerbocker Dr
- 1114 Jamestown Dr
- 1110 Jamestown Dr
- 1105 W Knickerbocker Dr Unit 6
- 1121 W Knickerbocker Dr
- 1106 Jamestown Dr
- 1122 Jamestown Dr
- 1110 W Knickerbocker Dr
- 1114 W Knickerbocker Dr
- 1125 W Knickerbocker Dr
- 1101 W Knickerbocker Dr
- 1106 W Knickerbocker Dr
- 1118 W Knickerbocker Dr
- 1102 Jamestown Dr
- 1126 Jamestown Dr
- 1102 W Knickerbocker Dr
- 1122 W Knickerbocker Dr
- 1129 W Knickerbocker Dr
- 1113 Jamestown Dr
Your Personal Tour Guide
Ask me questions while you tour the home.