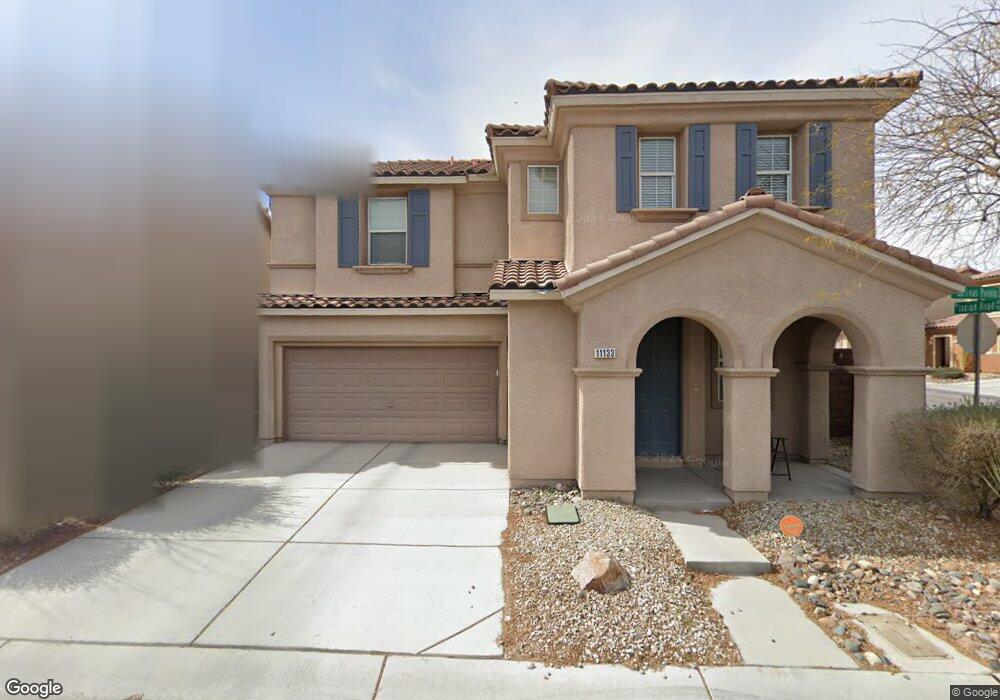
11133 Salinas Pueblo St Unit 1C Las Vegas, NV 89179
Mountains Edge NeighborhoodEstimated Value: $407,000 - $438,000
3
Beds
3
Baths
1,740
Sq Ft
$242/Sq Ft
Est. Value
About This Home
This home is located at 11133 Salinas Pueblo St Unit 1C, Las Vegas, NV 89179 and is currently estimated at $420,347, approximately $241 per square foot. 11133 Salinas Pueblo St Unit 1C is a home located in Clark County with nearby schools including Desert Oasis High School and Doral Academy Cactus.
Ownership History
Date
Name
Owned For
Owner Type
Purchase Details
Closed on
Jan 24, 2011
Sold by
Rblb Inc
Bought by
Rose James B
Current Estimated Value
Home Financials for this Owner
Home Financials are based on the most recent Mortgage that was taken out on this home.
Original Mortgage
$131,577
Outstanding Balance
$93,050
Interest Rate
5.5%
Mortgage Type
FHA
Estimated Equity
$327,297
Purchase Details
Closed on
Nov 22, 2010
Sold by
Fannie Mae
Bought by
Rblb Inc
Purchase Details
Closed on
May 6, 2010
Sold by
Samaniego Jose Paulo C and Samaniego Rosemarie H
Bought by
Federal National Mortgage Association
Purchase Details
Closed on
Jun 15, 2006
Sold by
Kb Home Nevada Inc
Bought by
Samaniego Jose Paulo C and Samaniego Rosemarie H
Home Financials for this Owner
Home Financials are based on the most recent Mortgage that was taken out on this home.
Original Mortgage
$246,552
Interest Rate
6.55%
Mortgage Type
Fannie Mae Freddie Mac
Create a Home Valuation Report for This Property
The Home Valuation Report is an in-depth analysis detailing your home's value as well as a comparison with similar homes in the area
Home Values in the Area
Average Home Value in this Area
Purchase History
| Date | Buyer | Sale Price | Title Company |
|---|---|---|---|
| Rose James B | $135,000 | Nevada Title Las Vegas | |
| Rblb Inc | $89,250 | Old Republic Title Company | |
| Federal National Mortgage Association | $283,625 | Accommodation | |
| Samaniego Jose Paulo C | $308,190 | First Amer Title Co Of Nv |
Source: Public Records
Mortgage History
| Date | Status | Borrower | Loan Amount |
|---|---|---|---|
| Open | Rose James B | $131,577 | |
| Previous Owner | Samaniego Jose Paulo C | $246,552 |
Source: Public Records
Tax History Compared to Growth
Tax History
| Year | Tax Paid | Tax Assessment Tax Assessment Total Assessment is a certain percentage of the fair market value that is determined by local assessors to be the total taxable value of land and additions on the property. | Land | Improvement |
|---|---|---|---|---|
| 2025 | $1,572 | $106,535 | $35,000 | $71,535 |
| 2024 | $1,527 | $106,535 | $35,000 | $71,535 |
| 2023 | $1,527 | $98,817 | $31,500 | $67,317 |
| 2022 | $1,482 | $87,718 | $26,250 | $61,468 |
| 2021 | $1,439 | $82,859 | $24,500 | $58,359 |
| 2020 | $1,394 | $81,228 | $23,450 | $57,778 |
| 2019 | $1,354 | $77,089 | $20,300 | $56,789 |
| 2018 | $1,314 | $70,331 | $16,100 | $54,231 |
| 2017 | $2,049 | $69,864 | $15,050 | $54,814 |
| 2016 | $1,245 | $61,439 | $11,200 | $50,239 |
| 2015 | $1,242 | $55,521 | $8,750 | $46,771 |
| 2014 | $1,206 | $39,891 | $5,600 | $34,291 |
Source: Public Records
Map
Nearby Homes
- 7063 Bering Strait Ave
- 11083 Camden Bay St
- 7012 Grand Junction Ave
- 6994 Geronimo Springs Ave
- 7115 Hickory Post Ave
- 7182 Hood River Ave
- 11173 Hickory Glen St
- 7057 Fort Union Ct
- 7134 Mountain Den Ave
- 7055 Fort Tule Ave
- 7125 Mountain Den Ave
- 7125 Neches Ave
- 10925 Prudhoe Bay St
- 7286 Caballo Range Ave
- 7104 Flathead River Ave
- 7397 Cobbhan Dr
- 0 W Erie Ave
- 7171 Sunny Countryside Ave
- 7414 Morisset Ave
- 10993 Dunoon St
- 11141 Salinas Pueblo St
- 11134 Ranch Valley St
- 11142 Ranch Valley St
- 11149 Salinas Pueblo St
- 7080 Indian Head Ave
- 11132 Salinas Pueblo St
- 11150 Ranch Valley St Unit 1C
- 7088 Indian Head Ave
- 11116 Salinas Pueblo St
- 11140 Salinas Pueblo St
- 7096 Indian Head Ave
- 11148 Salinas Pueblo St
- 11148 Salinas Pueblo St Unit n/a
- 11108 Salinas Pueblo St
- 11135 Ranch Valley St
- 11158 Ranch Valley St
- 11143 Ranch Valley St
- 7052 Grand Junction Ave
- 7104 Indian Head Ave