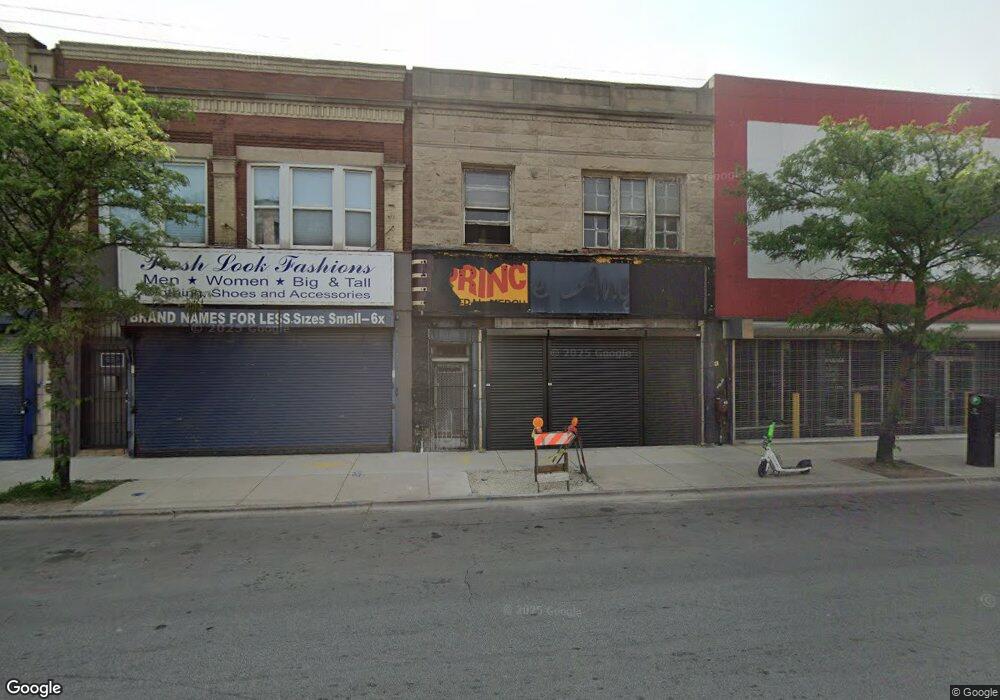
11135 S Michigan Ave Chicago, IL 60628
Roseland NeighborhoodEstimated Value: $81,342 - $180,000
5
Beds
5
Baths
4,000
Sq Ft
$34/Sq Ft
Est. Value
About This Home
This home is located at 11135 S Michigan Ave, Chicago, IL 60628 and is currently estimated at $135,781, approximately $33 per square foot. 11135 S Michigan Ave is a home located in Cook County with nearby schools including Curtis Elementary School, Corliss High School, and CICS Prairie.
Ownership History
Date
Name
Owned For
Owner Type
Purchase Details
Closed on
Jan 24, 2024
Sold by
Kyeon Tae Jong and Kum Sook
Bought by
Parks Shanequa
Current Estimated Value
Purchase Details
Closed on
Oct 19, 2011
Sold by
Suh Han Suk and Suh Clara
Bought by
Kyeon Tae Jong and Kyeon Kum Sook
Purchase Details
Closed on
Nov 25, 2003
Sold by
Nationwide Real Estate Investment Inc
Bought by
Suh Han Suk and Suh Clara
Purchase Details
Closed on
Dec 19, 1996
Sold by
Kastanes Christ P and Kastanes Zoe
Bought by
Nationwide Real Estate Investment Inc
Home Financials for this Owner
Home Financials are based on the most recent Mortgage that was taken out on this home.
Original Mortgage
$55,000
Interest Rate
7.54%
Mortgage Type
Seller Take Back
Create a Home Valuation Report for This Property
The Home Valuation Report is an in-depth analysis detailing your home's value as well as a comparison with similar homes in the area
Home Values in the Area
Average Home Value in this Area
Purchase History
| Date | Buyer | Sale Price | Title Company |
|---|---|---|---|
| Parks Shanequa | $70,000 | Chicago Title | |
| Kyeon Tae Jong | $110,000 | None Available | |
| Suh Han Suk | $130,000 | Multiple | |
| Nationwide Real Estate Investment Inc | $75,000 | -- |
Source: Public Records
Mortgage History
| Date | Status | Borrower | Loan Amount |
|---|---|---|---|
| Previous Owner | Nationwide Real Estate Investment Inc | $55,000 |
Source: Public Records
Tax History Compared to Growth
Tax History
| Year | Tax Paid | Tax Assessment Tax Assessment Total Assessment is a certain percentage of the fair market value that is determined by local assessors to be the total taxable value of land and additions on the property. | Land | Improvement |
|---|---|---|---|---|
| 2024 | $1,576 | $13,100 | $1,875 | $11,225 |
| 2023 | $1,539 | $6,000 | $2,969 | $3,031 |
| 2022 | $1,539 | $6,000 | $2,969 | $3,031 |
| 2021 | $1,481 | $5,999 | $2,968 | $3,031 |
| 2020 | $3,270 | $12,120 | $2,031 | $10,089 |
| 2019 | $3,360 | $13,931 | $2,031 | $11,900 |
| 2018 | $3,349 | $13,931 | $2,031 | $11,900 |
| 2017 | $3,415 | $12,887 | $1,875 | $11,012 |
| 2016 | $3,169 | $12,887 | $1,875 | $11,012 |
| 2015 | $2,868 | $12,887 | $1,875 | $11,012 |
| 2014 | $2,970 | $13,133 | $1,562 | $11,571 |
| 2013 | $2,919 | $13,133 | $1,562 | $11,571 |
Source: Public Records
Map
Nearby Homes
- 11241 S Michigan Ave
- 26 E 113th St
- 1 W 112th Place
- 6 W 111th Place
- 11317 S Edbrooke Ave
- 12551-53 S State St
- 118 W 113th Place
- 11000 S Michigan Ave
- 62 W 113th St
- 153 E 110th St
- 26 W 114th St
- 1 E 114th St
- 124 E 110th St
- 104 W 110th Place
- 10924 S Wabash Ave
- 11419 S Prairie Ave
- 106 W 114th St
- 10916 S Wabash Ave
- 11365 S Forest Ave
- 10910 S Edbrooke Ave
- 11133 S Michigan Ave
- 11131 S Michigan Ave
- 11145 S Michigan Ave
- 11127 S Michigan Ave
- 11119 S Michigan Ave Unit 21
- 11151 S Michigan Ave Unit 53
- 11151 S Michigan Ave
- 11138 S Michigan Ave
- 11134 S Edbrooke Ave
- 11140 S Edbrooke Ave
- 11134 S Michigan Ave
- 11132 S Michigan Ave
- 11132 S Edbrooke Ave
- 11150 S Michigan Ave
- 11152 S Michigan Ave
- 11144 S Edbrooke Ave
- 11148 S Edbrooke Ave
- 11148 S Edbrooke Ave
- 11118 S Edbrooke Ave
- 11118 S Edbrooke Ave Unit 2