
Seller's Agent in 2019
Mike Chenault
Hometown Realty
(804) 366-5302
32 in this area
219 Total Sales

Estimated Value: $908,000 - $1,235,242
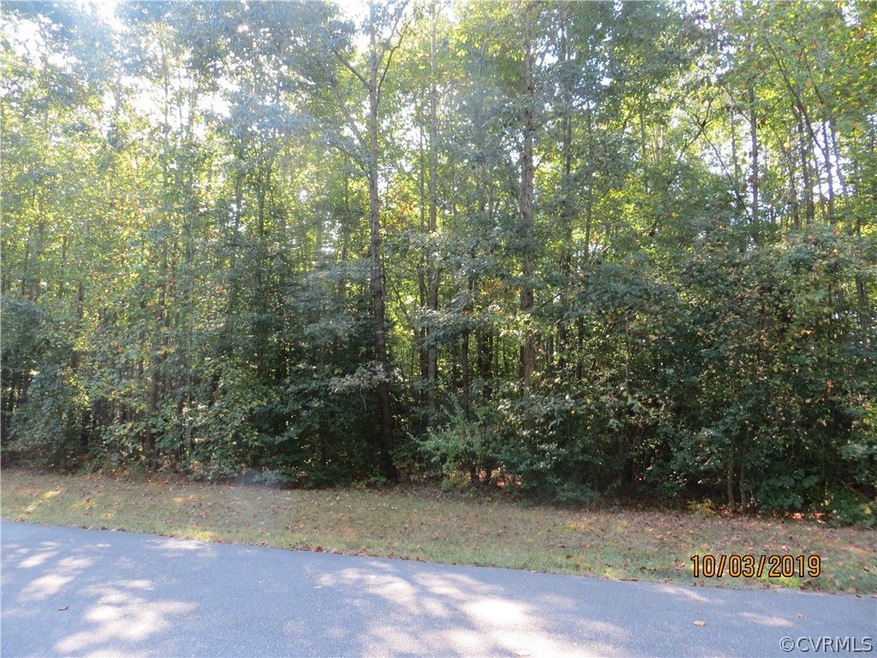
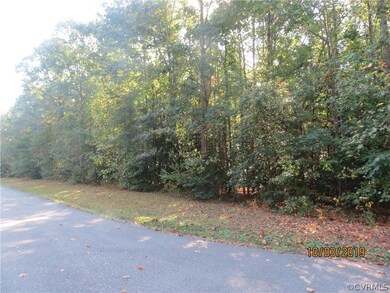
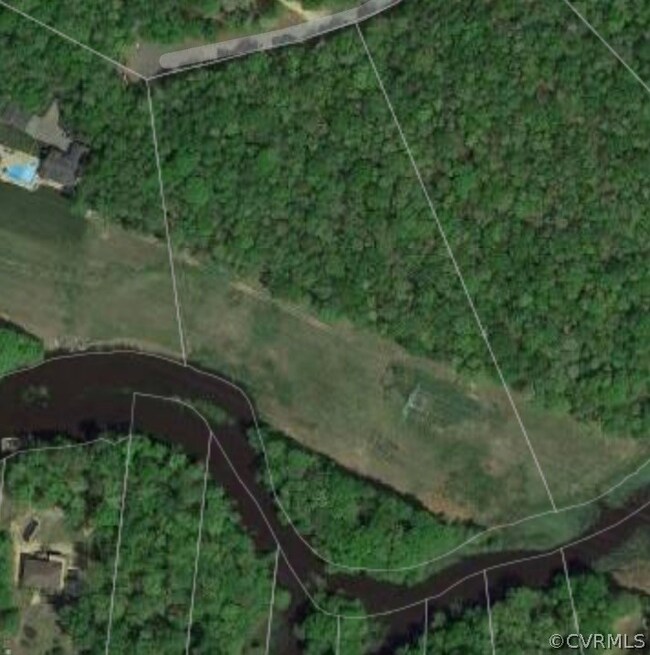
800' frontage on Chickahominy River! This beautiful lot is perfect for fishing, canoeing and enjoying the serenity of the landscape. Imagine your dream home here! Close to 295, route 1, and the Town of Ashland. Perc tests are complete and on file with the county.
Last Agent to Sell the Property
Hometown Realty License #0225059322 Listed on: 09/19/2019
| Date | Buyer | Sale Price | Title Company |
|---|---|---|---|
| Hughes John G | -- | None Available | |
| Hughes John G | -- | None Listed On Document | |
| Hughes Jennifer R | $200,000 | Attorney | |
| Neiman Jeffrey | $200,000 | -- |
| Date | Event | Price | List to Sale | Price per Sq Ft |
|---|---|---|---|---|
| 12/20/2019 12/20/19 | Sold | $200,000 | -9.1% | -- |
| 11/08/2019 11/08/19 | Pending | -- | -- | -- |
| 09/19/2019 09/19/19 | For Sale | $219,950 | -- | -- |
| Year | Tax Paid | Tax Assessment Tax Assessment Total Assessment is a certain percentage of the fair market value that is determined by local assessors to be the total taxable value of land and additions on the property. | Land | Improvement |
|---|---|---|---|---|
| 2025 | $8,471 | $1,045,800 | $173,300 | $872,500 |
| 2024 | $8,471 | $1,045,800 | $173,300 | $872,500 |
| 2023 | $8,123 | $1,002,800 | $165,200 | $837,600 |
| 2022 | $6,644 | $820,200 | $152,100 | $668,100 |
| 2020 | $1,077 | $133,000 | $133,000 | $0 |
| 2019 | $1,062 | $133,000 | $133,000 | $0 |
| 2018 | $1,062 | $131,100 | $131,100 | $0 |
| 2017 | $1,062 | $131,100 | $131,100 | $0 |
| 2016 | $1,062 | $131,100 | $131,100 | $0 |
| 2015 | $1,012 | $124,900 | $124,900 | $0 |
| 2014 | $1,012 | $124,900 | $124,900 | $0 |
Seller's Agent in 2019
Mike Chenault
Hometown Realty
(804) 366-5302
32 in this area
219 Total Sales
Source: Central Virginia Regional MLS
MLS Number: 1931145
APN: 7778-10-4217
Disclaimer: Certain information contained herein is derived from information provided by parties other than Homes.com. All information provided is deemed reliable, but is not guaranteed to be accurate and should be independently verified.
![]() All or a portion of th multiple Listing information is provided by the Central Virginia Regional Multiple Listing Service, LLC, from a copyrighted compilation of Listing s. All CVR MLS information provided is deemed reliable but is not guaranteed accurate. The compilation of Listings and each individual Listing are ©2026 Central Virginia Regional Multiple Listing Service, LLC. All rights reserved.
All or a portion of th multiple Listing information is provided by the Central Virginia Regional Multiple Listing Service, LLC, from a copyrighted compilation of Listing s. All CVR MLS information provided is deemed reliable but is not guaranteed accurate. The compilation of Listings and each individual Listing are ©2026 Central Virginia Regional Multiple Listing Service, LLC. All rights reserved.
Ask me questions while you tour the home.