Estimated Value: $668,000 - $1,007,000
4
Beds
4
Baths
3,735
Sq Ft
$227/Sq Ft
Est. Value
About This Home
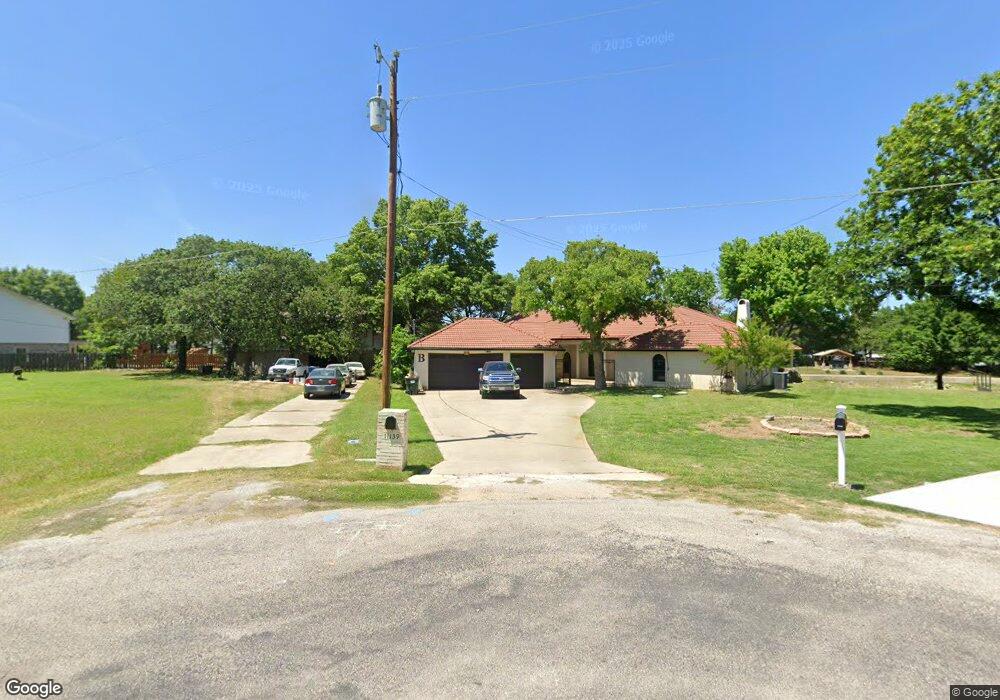
This home is located at 11139 Stanfield Rd, Azle, TX 76020 and is currently estimated at $847,135, approximately $226 per square foot. 11139 Stanfield Rd is a home located in Tarrant County with nearby schools including Liberty Elementary School, W E Hoover Elementary School, and Santo Forte Junior High School.
Ownership History
Date
Name
Owned For
Owner Type
Purchase Details
Closed on
Mar 7, 2018
Sold by
Fox Betty F
Bought by
Benne Donna and Benne Joey
Current Estimated Value
Home Financials for this Owner
Home Financials are based on the most recent Mortgage that was taken out on this home.
Original Mortgage
$275,000
Outstanding Balance
$233,301
Interest Rate
4.15%
Mortgage Type
New Conventional
Estimated Equity
$613,834
Purchase Details
Closed on
Apr 2, 2007
Sold by
Fox Ron and Fox Betty
Bought by
Fox Betty F and Ronald L & Betty F Fox 2007 Revocable Ma
Purchase Details
Closed on
Jun 17, 2005
Sold by
Sinker Robert A and Sinker Patricia
Bought by
Fox Betty
Home Financials for this Owner
Home Financials are based on the most recent Mortgage that was taken out on this home.
Original Mortgage
$240,000
Interest Rate
5.76%
Mortgage Type
Fannie Mae Freddie Mac
Create a Home Valuation Report for This Property
The Home Valuation Report is an in-depth analysis detailing your home's value as well as a comparison with similar homes in the area
Home Values in the Area
Average Home Value in this Area
Purchase History
| Date | Buyer | Sale Price | Title Company |
|---|---|---|---|
| Benne Donna | -- | Sendera Title | |
| Fox Betty F | -- | None Available | |
| Fox Betty | -- | Commerce Title Co |
Source: Public Records
Mortgage History
| Date | Status | Borrower | Loan Amount |
|---|---|---|---|
| Open | Benne Donna | $275,000 | |
| Previous Owner | Fox Betty | $240,000 |
Source: Public Records
Tax History Compared to Growth
Tax History
| Year | Tax Paid | Tax Assessment Tax Assessment Total Assessment is a certain percentage of the fair market value that is determined by local assessors to be the total taxable value of land and additions on the property. | Land | Improvement |
|---|---|---|---|---|
| 2025 | $8,391 | $567,000 | $197,518 | $369,482 |
| 2024 | $8,391 | $595,125 | $197,518 | $397,607 |
| 2023 | $7,495 | $739,244 | $197,518 | $541,726 |
| 2022 | $9,258 | $488,280 | $103,500 | $384,780 |
| 2021 | $9,174 | $488,280 | $103,500 | $384,780 |
| 2020 | $8,340 | $428,438 | $103,500 | $324,938 |
| 2019 | $8,281 | $408,845 | $103,500 | $305,345 |
| 2018 | $8,165 | $403,111 | $103,500 | $299,611 |
| 2017 | $7,443 | $413,869 | $145,500 | $268,369 |
| 2016 | $6,766 | $350,748 | $145,500 | $205,248 |
| 2015 | $6,092 | $415,200 | $145,500 | $269,700 |
| 2014 | $6,092 | $415,200 | $145,500 | $269,700 |
Source: Public Records
Map
Nearby Homes
- 11314 Stanfield Dr
- 11335 Eustace Dr
- 1616 Sandy Beach Rd
- 1941 Gale Dr
- 1357 Beach Dr
- 11484 Moran Rd
- 1820 Pelican Dr N
- 1441 Yachtclub Dr
- 1532 Gale Dr
- 1934 Long Cir
- 1436 Lakeview Dr
- 1804 Coral Rd
- 1409 Eagle Nest Dr
- 1701 Sheila Dr
- 1709 Sheila Dr
- 1417 Gilley Trail
- 1532 Laguna Bay N
- 1552 Laguna N
- 1618 Gale Dr
- 1534 Gale Dr
- 11129 Stanfield Rd
- 11160 Stanfield Rd
- 6814 Hill Ct
- 11150 Stanfield Rd
- 6800 Hill Ct
- 11140 Stanfield Rd
- 11130 Stanfield Rd
- 6824 Hill Ct
- 11250 Stanfield Dr
- 11120 Stanfield Rd
- 6834 Hill Ct
- 11254 Stanfield Dr
- 6833 Hill Ct
- 11264 Stanfield Dr
- 6754 Hill Ct
- 6844 Hill Ct
- 11224 Eustace Dr
- 6744 Hill Ct
- 6763 Hill Ct
- 11235 Stanfield Dr