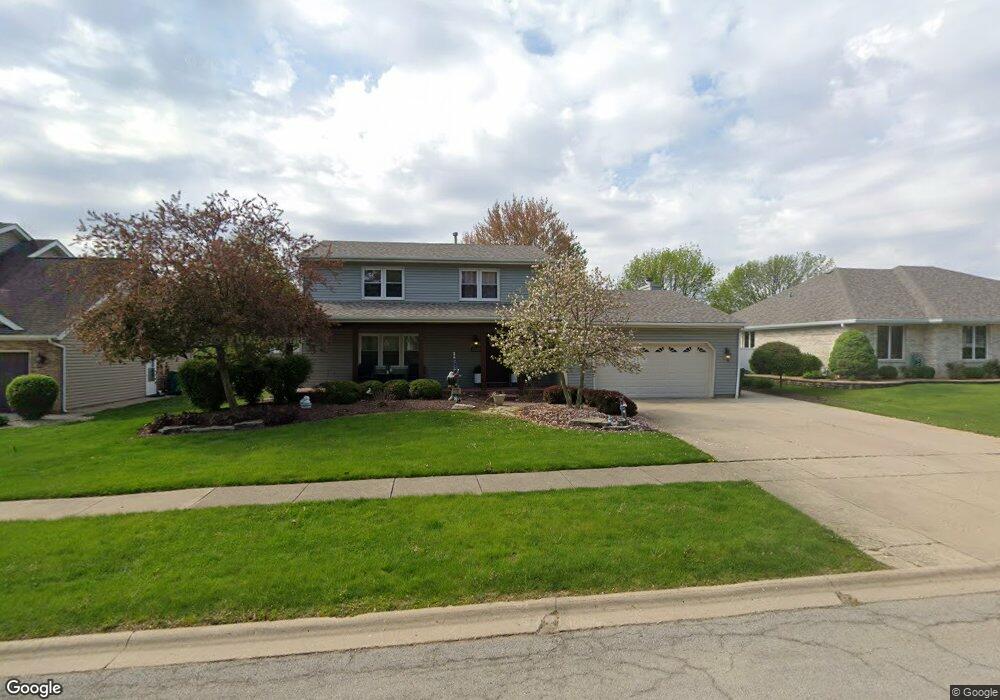
1114 Cambridge Ln Shorewood, IL 60404
Estimated Value: $396,787 - $440,000
4
Beds
3
Baths
2,170
Sq Ft
$193/Sq Ft
Est. Value
About This Home
This home is located at 1114 Cambridge Ln, Shorewood, IL 60404 and is currently estimated at $419,197, approximately $193 per square foot. 1114 Cambridge Ln is a home located in Will County with nearby schools including Walnut Trails Elementary School, Minooka Junior High School, and Minooka Intermediate School.
Ownership History
Date
Name
Owned For
Owner Type
Purchase Details
Closed on
Aug 25, 2004
Sold by
Kuzel Daniel R and Kuzel Alina
Bought by
Hennessy Jackie R
Current Estimated Value
Home Financials for this Owner
Home Financials are based on the most recent Mortgage that was taken out on this home.
Original Mortgage
$159,500
Outstanding Balance
$77,009
Interest Rate
5.5%
Mortgage Type
Purchase Money Mortgage
Estimated Equity
$342,188
Purchase Details
Closed on
Aug 31, 2000
Sold by
Kuzel Daniel R
Bought by
Kuzel Daniel R and Kuzel Alina Maria
Purchase Details
Closed on
Jul 10, 1998
Sold by
Fennewald Kevin J and Fennewald Katherine M
Bought by
Kuzel Daniel R
Purchase Details
Closed on
Sep 21, 1995
Sold by
Mauro Anthony R and Mauro Ann Marie
Bought by
Fennewald Kevin J and Fennewald Katherine M
Home Financials for this Owner
Home Financials are based on the most recent Mortgage that was taken out on this home.
Original Mortgage
$131,200
Interest Rate
7.65%
Create a Home Valuation Report for This Property
The Home Valuation Report is an in-depth analysis detailing your home's value as well as a comparison with similar homes in the area
Home Values in the Area
Average Home Value in this Area
Purchase History
| Date | Buyer | Sale Price | Title Company |
|---|---|---|---|
| Hennessy Jackie R | $239,500 | Ticor Title | |
| Kuzel Daniel R | -- | -- | |
| Kuzel Daniel R | $169,000 | -- | |
| Fennewald Kevin J | $164,000 | Greater Illinois Title Compa |
Source: Public Records
Mortgage History
| Date | Status | Borrower | Loan Amount |
|---|---|---|---|
| Open | Hennessy Jackie R | $159,500 | |
| Previous Owner | Fennewald Kevin J | $131,200 |
Source: Public Records
Tax History Compared to Growth
Tax History
| Year | Tax Paid | Tax Assessment Tax Assessment Total Assessment is a certain percentage of the fair market value that is determined by local assessors to be the total taxable value of land and additions on the property. | Land | Improvement |
|---|---|---|---|---|
| 2024 | $8,492 | $119,550 | $22,028 | $97,522 |
| 2023 | $8,492 | $107,413 | $19,792 | $87,621 |
| 2022 | $7,469 | $101,640 | $18,728 | $82,912 |
| 2021 | $7,027 | $95,616 | $17,618 | $77,998 |
| 2020 | $6,671 | $89,759 | $17,618 | $72,141 |
| 2019 | $6,536 | $86,100 | $16,900 | $69,200 |
| 2018 | $6,238 | $81,450 | $16,900 | $64,550 |
| 2017 | $5,863 | $75,950 | $16,900 | $59,050 |
| 2016 | $5,690 | $72,800 | $16,900 | $55,900 |
| 2015 | $4,774 | $68,040 | $15,390 | $52,650 |
| 2014 | $4,774 | $64,933 | $15,390 | $49,543 |
| 2013 | $4,774 | $64,933 | $15,390 | $49,543 |
Source: Public Records
Map
Nearby Homes
- 00002 Jefferson St
- 1 AC Jefferson St
- 00001 Jefferson St
- 0000 W Seil Rd
- 1007 Windsor Dr
- 22020 S River Rd
- 24614 Kaylee St
- 20941 Lee St
- 2057 Isabella Ln
- 2031 Isabell Ln Unit 1
- 2037 Isabell Ln
- 2048 Isabella Ln
- 1018 Butterfield Cir E Unit 5
- 704 Flag Dr
- 20948 Lakewoods Ln
- 741 River Bluff Dr
- 20718 S Sarver Dr Unit 1
- 21053 Benjamin Dr
- 312 Honors Dr
- 1228 Conquest Ct
- 1116 Cambridge Ln Unit 6
- 1112 Cambridge Ln
- 1110 Cambridge Ln Unit 6
- 411 Stanford Dr
- 1119 Cambridge Ln
- 1117 Cambridge Ln
- 409 Stanford Dr Unit 6
- 1108 Cambridge Ln
- 1115 Cambridge Ln
- 415 Stanford Dr
- 1121 Cambridge Ln
- 407 Stanford Dr
- 719 Cambridge Ln
- 1106 Cambridge Ln
- 1113 Cambridge Ln Unit 6
- 1201 Chartwell Ct
- 1203 Chartwell Ct
- 405 Stanford Dr
- 1111 Cambridge Ln
- 418 Stanford Dr